Microeconomics
Macroeconomics
SISTERetrics
SITES
Compleat World Copyright Website
World Cultural Intelligence Network
Dr. Harry Hillman Chartrand, PhD
Cultural Economist & Publisher
©
h.h.chartrand@compilerpress.ca
215 Lake Crescent
Saskatoon, Saskatchewan
Canada,
S7H 3A1
Launched 1998
|
Microeconomics 4.0 Markets
|
|
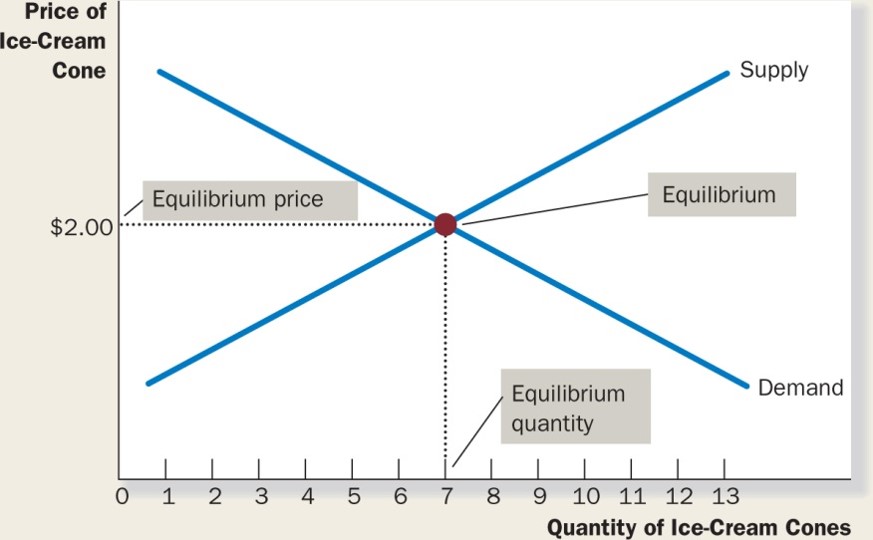
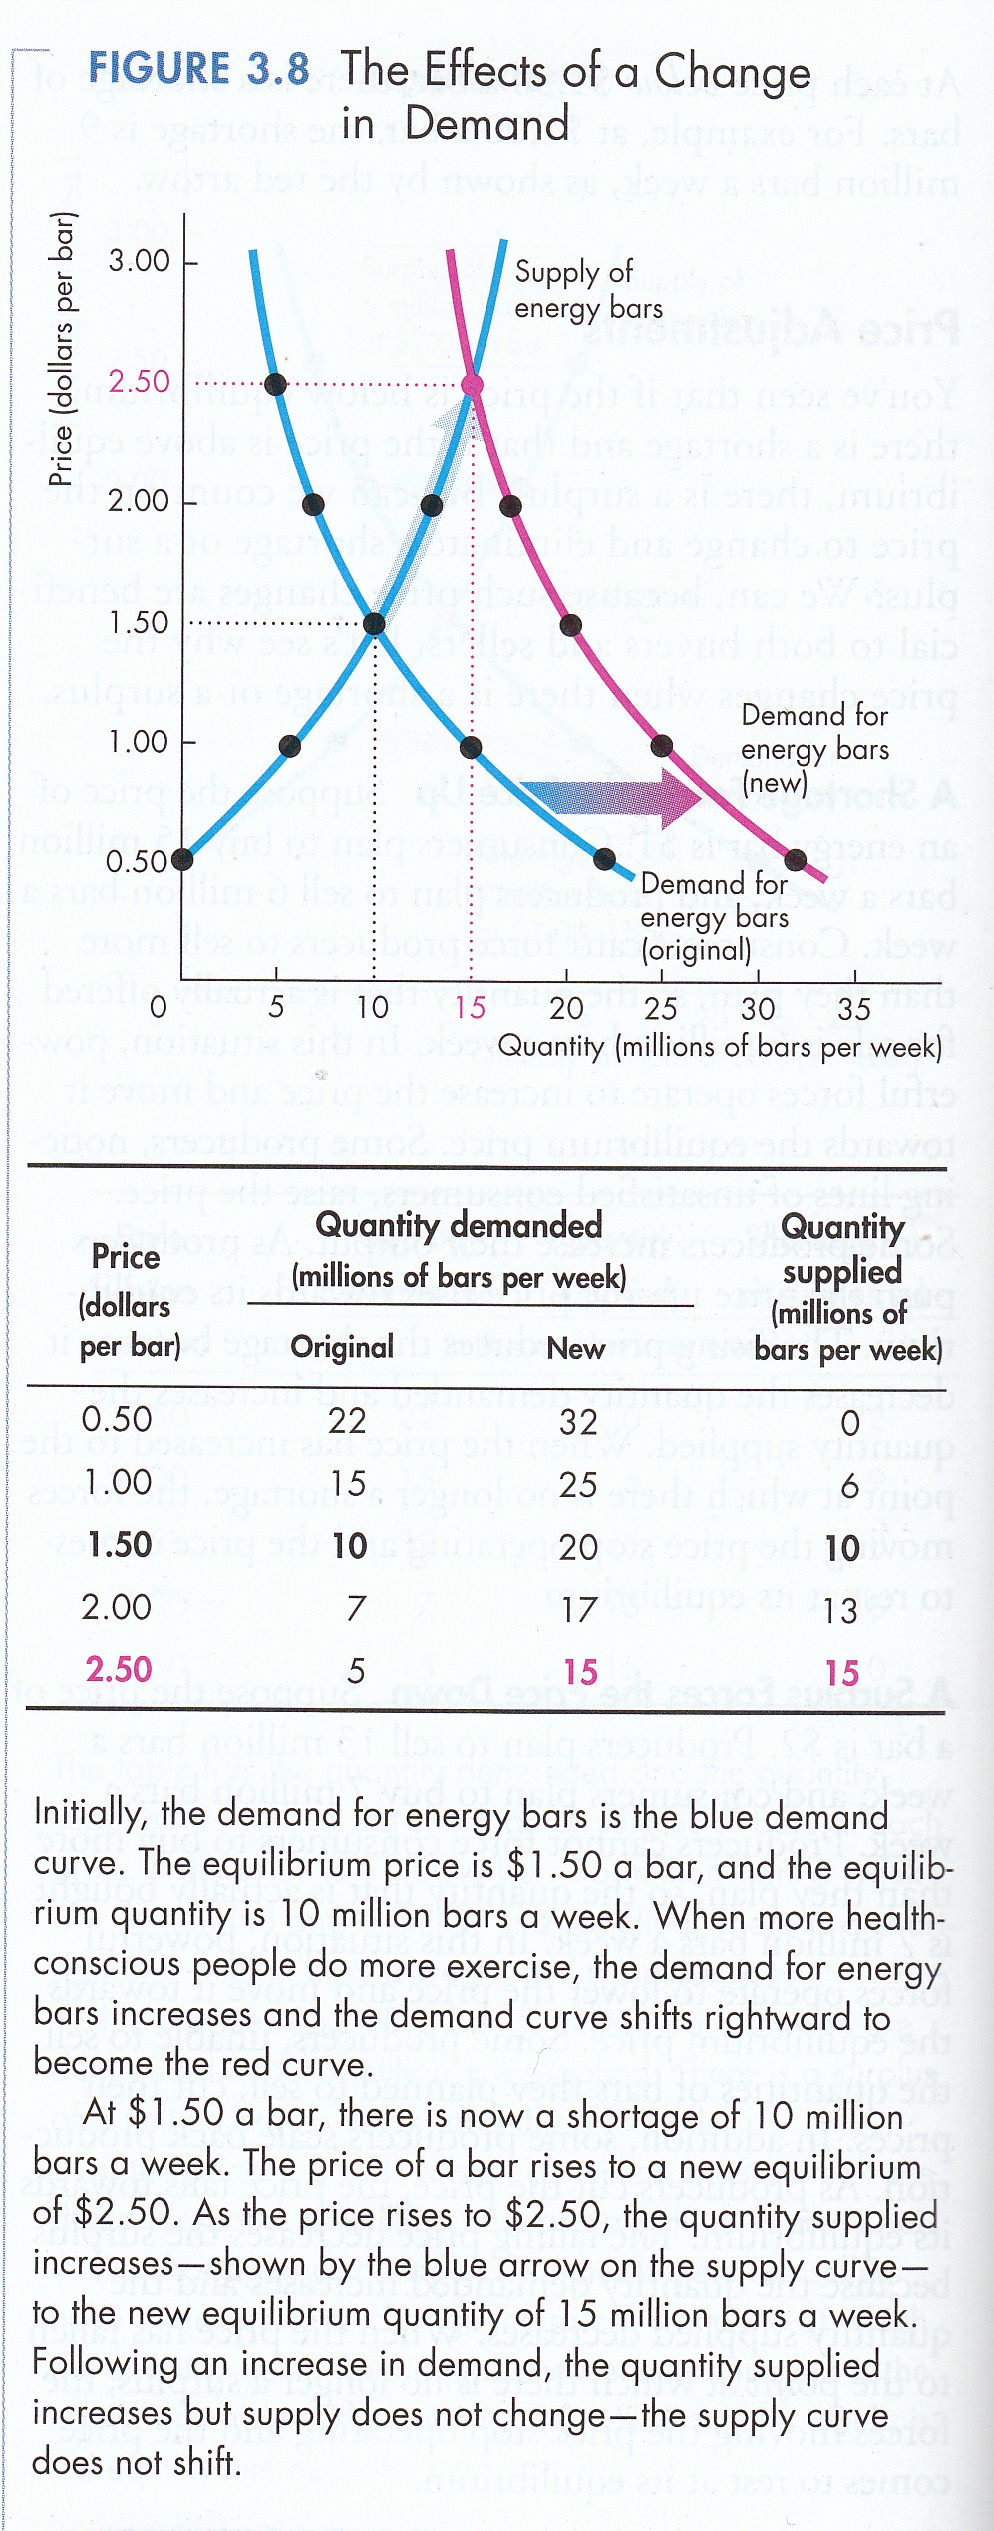
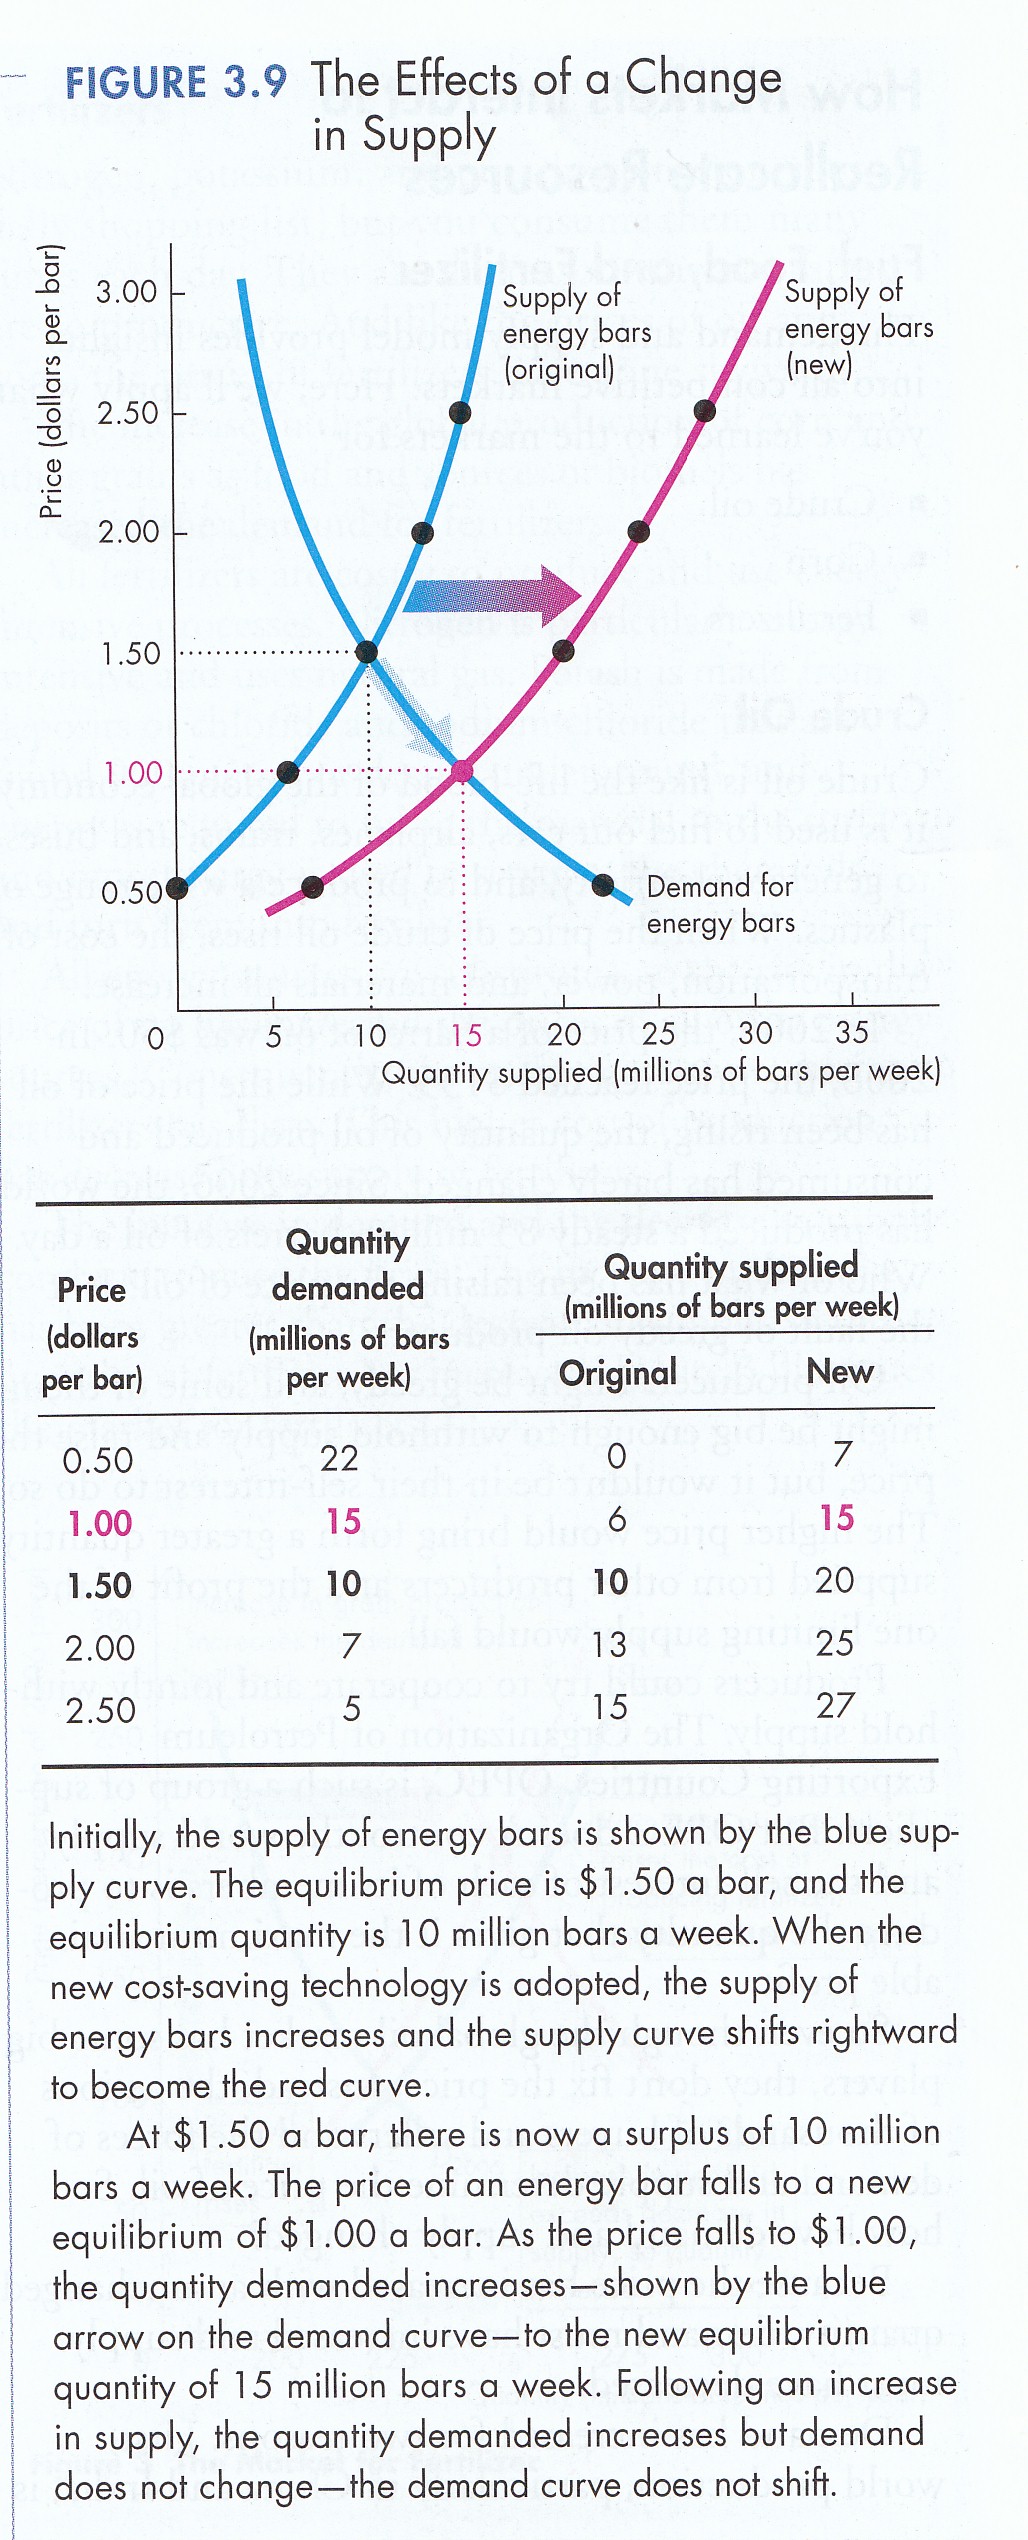
Markets exist anywhere, in real or virtual space, that buyers and sellers can transact business (MKM C4/68). Put another way, Markets are where Demand meets Supply setting a price/quantity that clears the market; ‘X’ marks the spot where the willingness to buy exactly matches the willingness to sell (MKM Fig 4.8). Markets can be: - commodity-based, geographic or virtual; - in or out of equilibrium (MKM Fig 4.9 a & b); - sensitive or insensitive to changes in price, income, taste or technology; - influenced by someone - consumer, producer or government - who alters the price/quantity outcome by exercising market power. 1. Market Demand Curve (MKM C4/69-75; 64-70; 66-72; 61-66) The Demand Curve for each individual consumer shows demand at each price. At any given price we can, horizontally in Cartesian space, sum up how much all consumers are willing to buy at each price. Hence, the Industry Demand Curve is the horizontal summation of the individual demand curves of each consumer. The Market Demand Curve is thus an aggregation of individual consumer demand curves. As will be seen, and importantly, what can be aggregated can sometimes be disaggregated. All things being equal, the higher the price of a good or services, the smaller the quantity demanded. This is the Law of Demand. Among other things the law reflects the substitution and income effect of a price increase on the quantity of a good demanded by consumers. i - Substitution Effect: when the price of a good increases it does so relative to all other goods. Although each good is unique it has substitutes - other goods that will serve almost as well. As the opportunity cost of a good rises, people will tend to buy less of it and more of its substitutes. ii - Income Effect: when the price of a good rises, all things being equal, it rises relative to income. Faced with a higher price and an unchanged income, the quantity of at least some goods and services must decrease. The demand curve can, however, shift, if other prices or other factors change (P&B 7th Ed Fig. 3.8; MKM Fig. 4.10). A shift in the demand curve can result due to changes in:
i - Price of Other Goods or
Services;
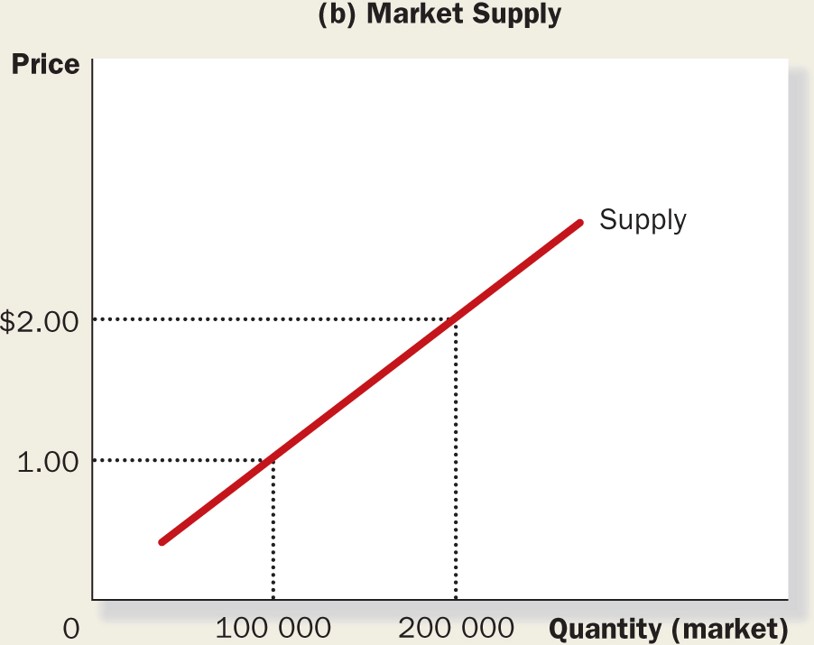
2. Market Supply Curve
(MKM
C4/75-9;
70-74;
72-76;
66-70)
i - Price of Factors of Production;
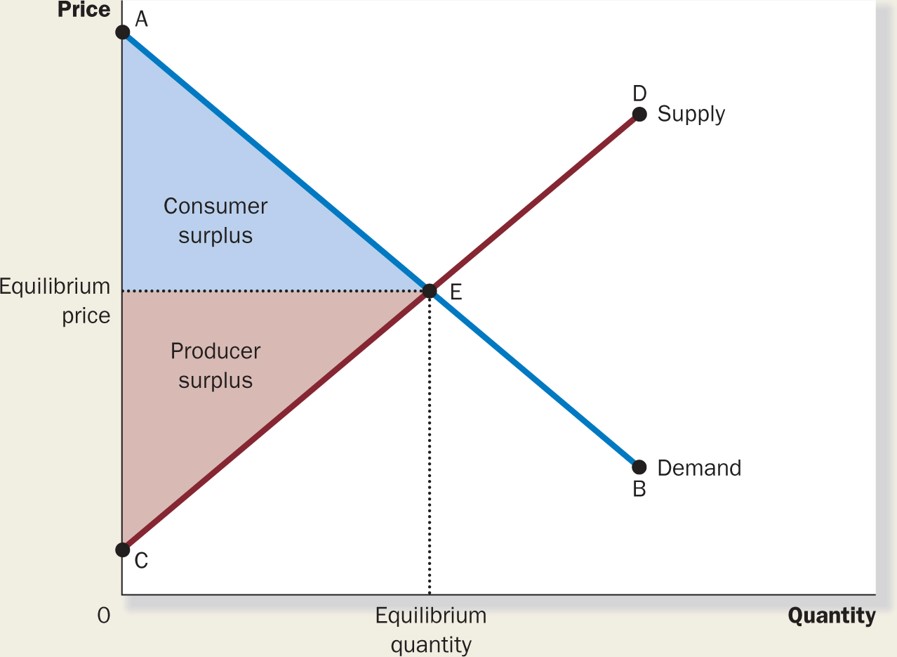
3. Consumer & Producer Surplus (MKM C7/150-8; 139-48; 146-155; 132-140) The market demand curve (MKM C7/Fig. 7.7, AB) demonstrates that consumers are willing to pay a higher price for a smaller quantity due to the Law of Diminishing Marginal Utility. The market supply curve (CD) demonstrates that producers are willing to sell a larger quantity at a higher price due to the Law of Eventually Diminishing Marginal Product. The intersection of the two curves at E sets the market clearing equilibrium price and quantity. It is achieved through a process called 'tâtonnement', a concept introduced by French economist Léon Walras (1834–1910). It is a trial-and-error process by which equilibrium prices and stability are reached in competitive markets.
For producers this means that there is a difference between what they were willing to accept in payment for every unit before equilibrium. This difference is measured from equilibrium price DOWN to the market supply curve (CD). It is called producer surplus. It shows the difference between how much producers were willing to accept and how much they actually received. As will be seen, under Perfect Competition consumers and producers keep their respective surplus. Under Imperfect Competition, however, market power is used to appropriate part of the consumer surplus into economic, excess or monopoly profits. It is the consumer's willingness to pay a higher price for a smaller quantity that allows Imperfect Competitors to do so.
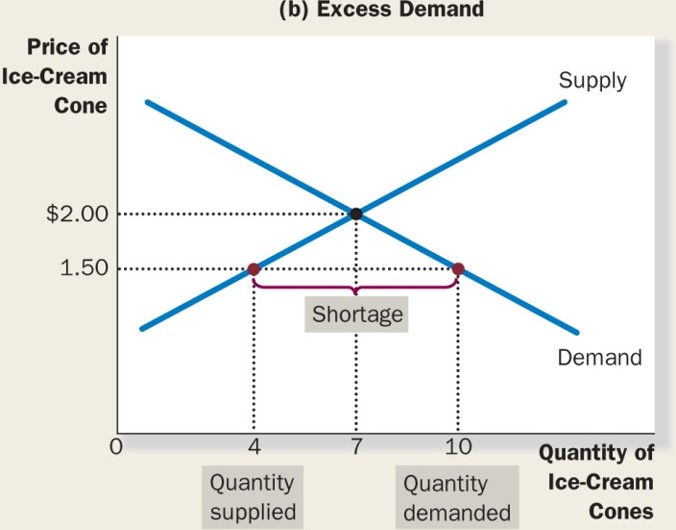
4. Market Forces:
Surplus/Shortage
(MKM
C4/80-1; 75-6;
76-78;
70-71)
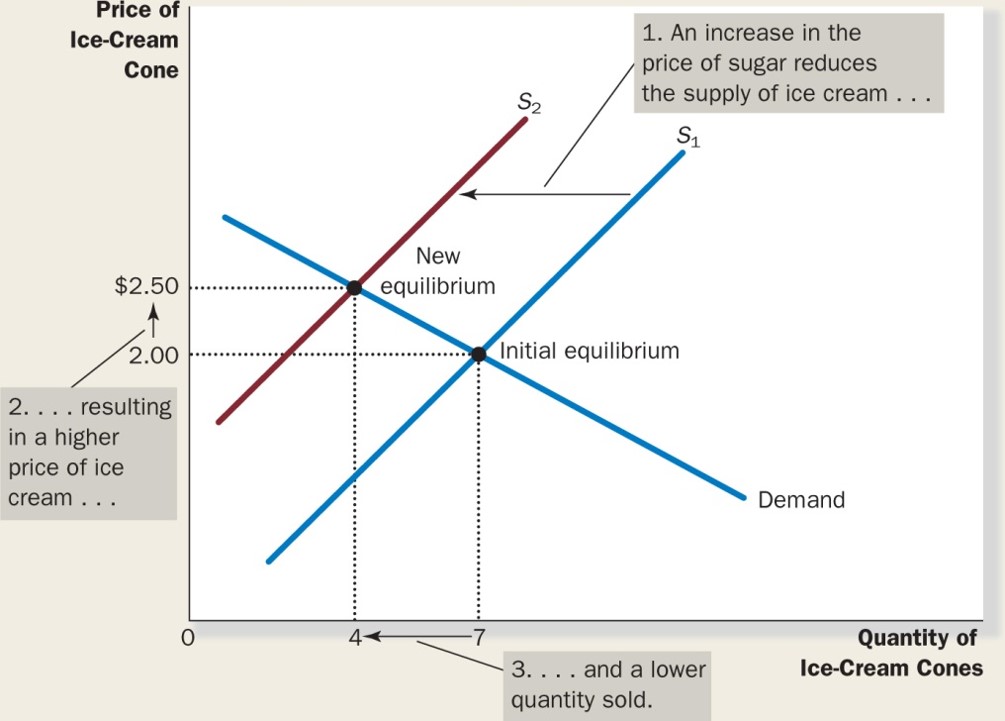
The tendency of producers to lower price faced with
a surplus and consumers to bid up price faced with a shortage is called
Market Forces. These tend to keep the market price/quantity where ‘X’
marks the spot.
|
 For
consumers this means that there is a difference between what they were
willing to pay for every unit before equilibrium. This difference
is measured from equilibrium price UP to the market demand curve (AB).
It is called consumer surplus. It shows the difference between how
much consumers were willing to pay and how much they actually paid.
For
consumers this means that there is a difference between what they were
willing to pay for every unit before equilibrium. This difference
is measured from equilibrium price UP to the market demand curve (AB).
It is called consumer surplus. It shows the difference between how
much consumers were willing to pay and how much they actually paid.