Microeconomics
Macroeconomics
SISTERetrics
SITES
Compleat World Copyright Website
World Cultural Intelligence Network
Dr. Harry Hillman Chartrand, PhD
Cultural Economist & Publisher
©
h.h.chartrand@compilerpress.ca
215 Lake Crescent
Saskatoon, Saskatchewan
Canada,
S7H 3A1
Launched 1998
|
Macroeconomics 6.0 The Global Economy
|
|
0. Global GDP Comparisons CIA World Fact Book (The World Factbook - The World Factbook (cia.gov); Forbes Tax Burden; The Global Economy 1. Comparative Advantage, Competitiveness & Fitness (MKM C/3 53-58: 52-56; 54-60) If the production function is the most elegant contribution to thought by economics, i.e., Y = f (K, L, N), then the theory of comparative advantage is one of its most obscure. When challenged by mathematician Stanislaw Ulam to “name me one proposition in all of the social sciences which is both true and non-trivial,” the Nobel Prize winning economist Paul Samuelson responded with the theory of comparative advantage because: "That it is logically true need not be argued before a mathematician; that it is not trivial is attested by the thousands of important and intelligent men who have never been able to grasp the doctrine for themselves or to believe it after it was explained to them (Samuelson 1969)." This obscurity partially results because the theory engages a complex web of economic ideas including absolute advantage, division and specialization of labour, division of labour limited by the size of the market, exchange, factor endowments, opportunity cost, production possibility frontiers, relative prices, separation of consumption from production and trade. Furthermore, it would more accurately be called the theory of comparative cost rather than of advantage. And, of course, some of its results appear counter-intuitive. Semantic obscurity has lead to the theory finding general expression as a numeric example such as that first used by David Ricardo to demonstrate the theory in his 1817 book The Principles of Political Economy and Taxation. In his case, it concerned wheat and wine production in England and Portugal. In summary, comparative advantage means that mutually beneficial exchange is possible whenever relative production costs differ prior to trade. One of its counter-intuitive deductions, however, is that if a country enjoys an absolute advantage in the production of all goods and services, i.e., can produce all of them cheaper than anyone else, it is still better off trading with other countries. The theory was used by Ricardo to counter arguments in favour of protective tariffs and trade barriers which, intuitively, promise national prosperity. It continues to serve this free-trade purpose. The theory attributes the cause and benefits of international trade to the differences among countries in the opportunity cost (cost in terms of other goods given up) of producing the same commodities. In Ricardo's theory, labour was the only factor of production. Furthermore, according to Ricardo, the fact that one country could produce everything more efficiently than another was not an argument against international trade. The theory of comparative advantage, in effect, separates consumption from production. Without trade, a nation can only consume what it produces. With trade, it is able to consume more than it produces. Put another way, by specializing in what it does best, a nation can afford to buy more of what it does worst. There are, however, limits - see: Ideological Evolution: Ch. 14 - Competitiveness, 14.4 - Comparative Advantage.
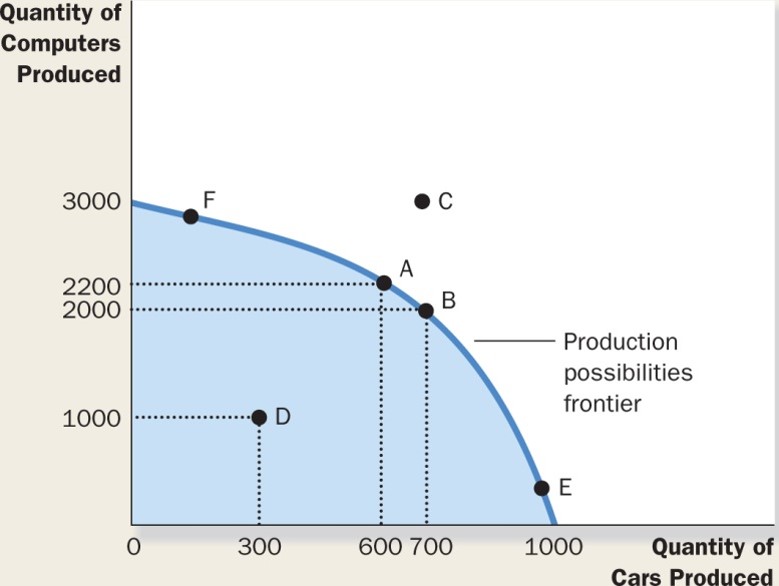
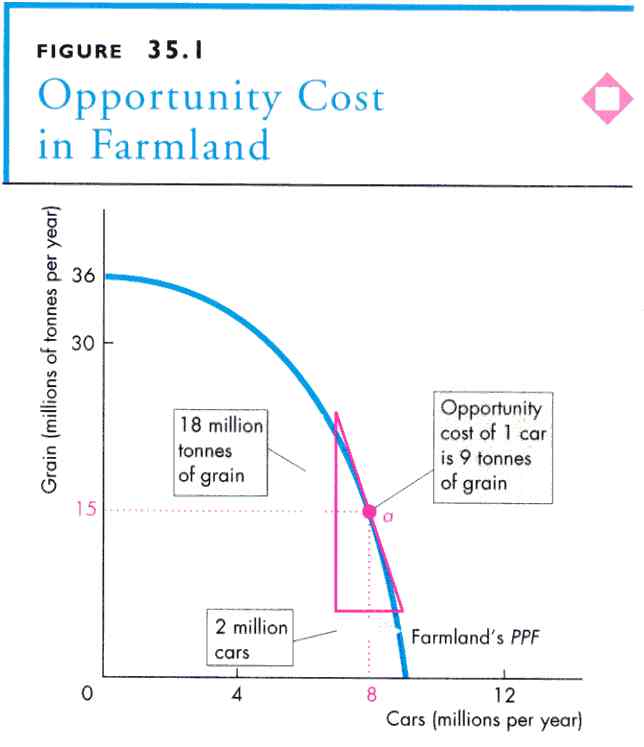
The theory of comparative advantage provides a strong argument in favour of free international trade and specialization among countries. For clarity, the theory is usually first outlined as though only two countries and only two commodities are involved, although the principles are by no means limited to such cases. Consider the production possibility frontier (PPF) of 'Farmland' (P&B Fig. 35.1; MKM Figs, 2.2, 2.3, 3.1 & 3.2). If all resources were committed to producing grain then 36 millions tons would result. If all resources were committed to producing cars some 9 million cars would be produced. The PPF shows the alternative amounts of grain or cars that could be produced if resources were divided between these two activities. The slope of the PPF measures the 'opportunity cost' of producing one car measured by how many tons of grain could not be produced.
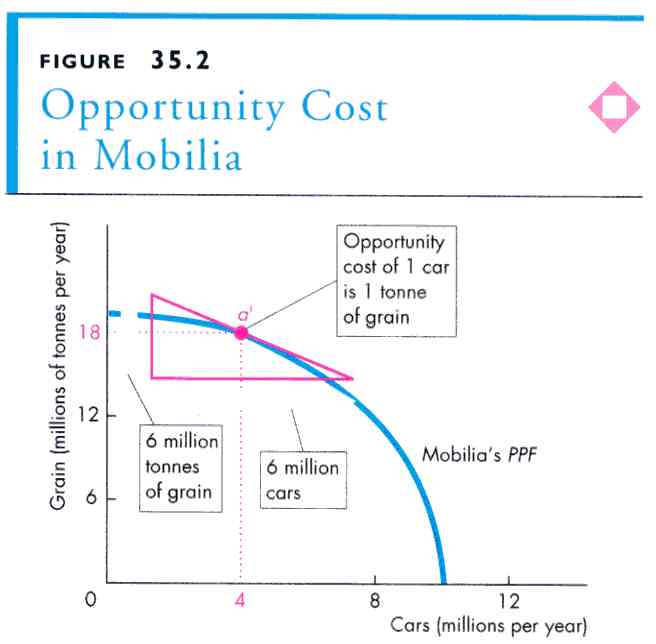
By way of contrast consider the PPF of Mobilia
(P&B
Fig. 35.2). If all resources were committed to grain then 19
tons would be produced; if all resources were committed to cars, then about 10
million cars would come off the production line. As above the slope of the
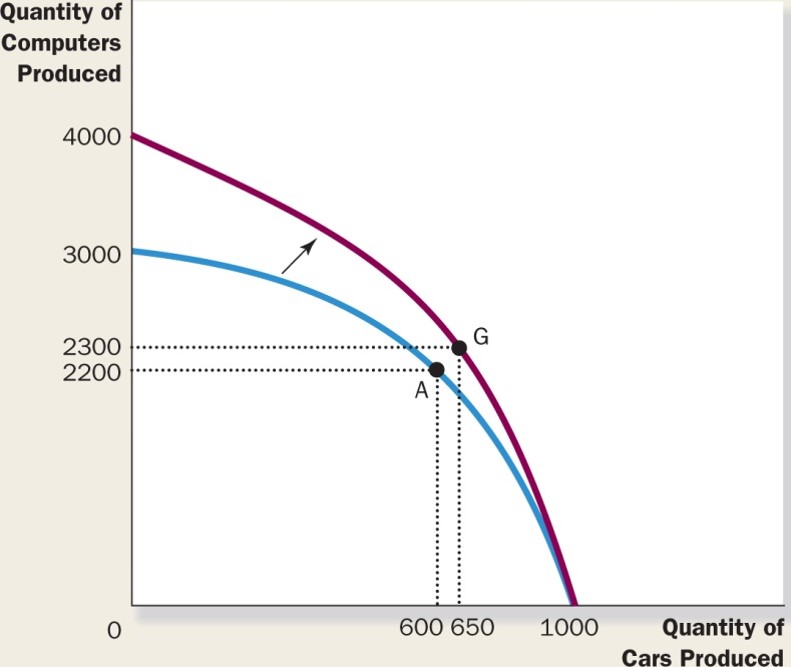
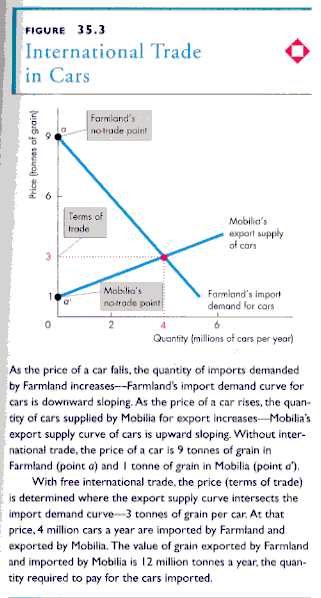
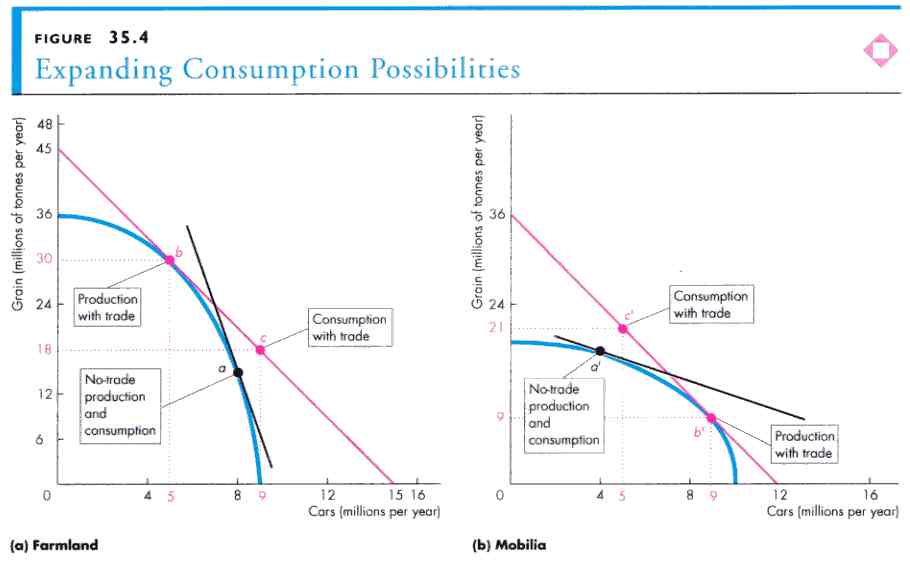
PPF measures the opportunity cost of producing cars vs grain. In both cases, a country chooses which combination of the two goods to produce and consume. For Farmland it is assumed to be 15 tons of grain and 8 million cars. For Mobilia, it is 18 million tons of grain and 4 million cars. This mix of outputs assumes no international trade between the two. The production/consumption mix must be on the PPF. Cars are cheaper in Mobilia (one car costs one ton of grain compared to 9 tons in Farmland; grain is cheaper in Farmland (9 tons cost one car compared to nine cars in Mobilia). Each has a comparative advantage in one commodity where comparative advantage is defined as the ability to produce a given good or service cheaper than another country. If they were to trade both would benefit. Mobilia would get cheaper grain and Farmland would get cheaper cars. First considering only international trade in cars. Farmland has a demand curve reflecting the quantity of imported cars it would be willing to buy at various prices (measured in tons of grain - P&B Fig. 35.3). If the price were the same as the domestic cost of production (9 tons) no cars would be imported. At any price less that that some cars would be imported. For Mobilia there is a supply curve of cars it would be willing to sell at various prices (measured in tons of grain). If the price were the same as the cost of domestic production (1 ton) the Mobilia would not trade. At any price higher than the domestic cost of production it would be willing to trade. Where demand equals supply exchange takes place at a price of 3 tons of grain 4 million cars will be imported into Farmland and 12 million tons of grain exported to Mobilia. In this exchange it is assumed a balance of trade will result. The effect of trade is to move the consumption possibility curve off and away from the PPF (P&B Fig. 35.4). The consumption possibility curve reflects the 'terms of trade', i.e. 3 tons of grain for 1 car. Where this curve is tangent to each countries PPF marks the new output combination. For Farmland 30 tons of grain and 5 million cars; for Mobilia, 9 tons of grain and 9 million cars. However, due to trade each can now consume more than before trade. Thus Farmland now consumes 18 million tons of grain an 9 million cars (compared to 15 million tons of grain and 8 million cars without trade); and Mobilia now consumes 21 million tons of grain and 5 million cars (compared to 18 tons of grain and 4 million cars without trade). Both are better off. Even if one country has an 'absolute advantage' in both commodities, it still pays to trade. The reason is opportunity cost. Thus while output may be greater for the same level of inputs in one country, there remains an opportunity cost to producing one vs. the other commodity. As long as the opportunity cost of another country is less it still pays to trade. There is no doubt that competitiveness in the division and specialization of labour available through free trade leads to a higher level of consumption and hence well-being of domestic consumers. Similarly, there is no doubt that some industries win and some lose in a given nation creating lobbying forces in favour and against trade. But competitiveness in the form of comparative advantage has its limits. Competitiveness is generally expressed in sports metaphors such as: “skating where the puck is going, not where it is” which captures its anticipative nature (Wilson 1992). In this game, however, some win and some lose in an “us/them” conflict deciding the destiny of our children, our communities and our country. Arguably, global competitiveness has ideologically quenched the last embers of the ‘60s revolution of rising expectations. Fear of job loss has smothered the hopes of citizen consumers and workers. Instead of George H. Bush Sr.’s “kinder and gentler society”, we live with George W. Bush Jr.s fear of downsizing, obsolescence, out sourcing, privatization, redundancies and technological displacement. In sports, it is the opposing team that is the challenge. The playing field, the environment itself, is generally fixed, invariant and subsidiary to the consciousness of players at play. In biology, however, natural selection involves not just an opponent but also new invariants and affordances thrown up by an ever changing environment including predator, prey, possible mates and/or symbionts (Grene & Depew 2004). Environmental invariants become subsidiary or 'tacit' to our focal awareness of affordances. In this view, 'knowledge' is orientation in an environment resulting from the tacit integration of subsidiary and focal awareness into a gestalt whole (Polanyi Oct. 1962) called 'knowing' one's 'fitness landscape'. In fact, comparative advantage is a natural phenonmenon: Economics has its roots in agency and the emergence of advantages of trade among autonomous agents. The advantages of trade predate the human economy by essentially the entire history of life on this planet. Advantages of trade are found in the metabolic exchange of legume root nodule and fungi, sugar for fixed nitrogen carried in amino acids. Advantages of trade were found among the mixed microbial and algal communities along the littoral of the earth’s oceans four billion years ago. The trading of the econosphere is an outgrowth of the trading of the biosphere. (Kauffman 2000, 211) To demonstrate the advantages of trade, Kauffman uses a biological example that, to my mind at least, is intuitive: Consider two bacterial species, red and blue. Suppose the red species secretes a red metabolite, at metabolic cost to itself, that aids the replication rate of the blue species. Conversely, suppose the blue species secretes a different blue metabolite, at metabolic cost to itself, that increases the replication rate of the red species. Then the conditions for a mutualism are possible. Roughly stated, if blue helps red more than it costs itself, and vice versa, a mixed community of blue and red bacteria may grow. How will it happen? And is there an optimal “exchange rate” of blue-secreted metabolite to red-secreted metabolite, where that exchange rate is the analogue of price? (Kauffman 2000, 216-17)
How it will happen and at what rate it will happen is determined by coevolution. The benefits of trade lead each to adjust to the other until optimal growth is achieved by both. Without each others help, individually, each would be less fit. In such a symbiotic relationship there is also potentiality for emergence of a higher order autonomous agent, e.g., prokaryotes coevolving into eukaryotes. Given such an active environment, autonomous agents – organisms or institutions – constantly adapt, adjust and evolve or go extinct. They adapt by experimenting with mutations called preadaptations or exaptations. According to Kauffman, these come from the adjacent possible consisting “of all those molecular species that are not members of the actual, but are one reaction step away from the actual” (Kauffman 2000, 142). In the noösphere, it is those new ideas generated by 'research & development' in the natural & engineering sciences, new ideologies generated by the humanities & social sciences including the so-called management sciences and by the new aesthetics, forms and designs thrown up by the Arts. Economic, epistemic and biological systems expand or explore the adjacent possible as quickly as possible subject to timely selection of the fit and unfit, e.g., going out of business. Such timely selection is called ‘early visibility’ and ‘fast failing’ in the innovation literature (The Economist Oct. 11, 2007). If selection takes too long, then fitness may decline or simply melt away. Arguably, this explains ‘de-industrialization’ of the Anglosphere. They maintained existing plant and equipment, e.g., in steel production, until fully depreciated through voluntary (and sometimes involuntary) quotas on imports from developing Asian producers who were investing in the best new technologies emerging from the adjacent possible. The fitness of the West, or rather the Anglosphere, fell, at least in terms of the traditional manufacturing-based economy. In this sense Darwinian fitness is not simply bodily strength, intelligence, vigor or bravery vis-à-vis rivals. Rather, fitness is a compounded result of the mutual relationship between an organism and its environment including symbiotic as well as predator/prey relationships. And symbionts can significantly enhance fitness, i.e., the probability one will survive and leave descendants. Arguably this is what the European Union and to a lesser extent what NAFTA represent: the symbiotic survival of the nation-state in a global knowledge-based economy. For a more detailed analysis, please see my assessment of the changing sands of sovereignty upon which the modern Nation-State rest as well as my comparison between competitiveness and 'fitness' as a test:
2. Exports, Imports, Deficit & Surplus (MKM Ch. 12 all editions) Exports are what we sell and imports are what we buy from other countries. The balance of trade is the difference between our exports and imports. If imports exceed exports there is a 'trade deficit' that must be financed by borrowing from abroad or selling off assets. If exports exceed imports there is a 'trade surplus' and the difference can be used to lend to other countries or buy assets. As will be seen trade in goods & services makes up the bulk of the 'current account' with other countries. There is also a 'capital account'. Together - capital and current - constitute the 'balance of payments'. What we buy and sell includes goods and services. Goods are fairly straight forward. They essential include things produced by the primary and secondary sectors of the economy. The primary sector includes farming, fishing, forestry and mining industries. The secondary sector involves the manufacturing industries. The tertiary sector involves services are a little more complex. Some are fairly obvious like tourism and transportation, e.g. a Canadian goes to France and stays in a hotel, buys restaurant food, etc. and this counts as an import; a French person comes to Canada and does the same and it counts as an export. As they say: follow the money. Some services are more intangible like banking and management services, engineering and design services as well as the flow of intellectual property royalties. Furthermore, with multi- or trans-national corporations there is the problem of intra-corporate transfer pricing which involves, among other things, maximum avoidance of tax given the different jurisdictions in which they operate. Canada's pattern of trade is dominated by the U.S., both with respect to imports and exports. China, Japan and the UK are our next most important export markets. While our exports flow principally from the primary industries, secondary and tertiary industries are slowly growing as export players. We are no longer just "hewers of wood and drawers of water". By contrast our imports are dominated by secondary and tertiary sectors. However, it is increasingly from the 'quaternary sector', i.e. royalties on intellectual property rights (IPRs) which constitute the legal foundation for the industrial organization of a knowledge-based economy. The evolution of the multilateral intellectual and cultural property rights regime is traced out in one of my articles. I will, in class, outline the nature of IPRs.
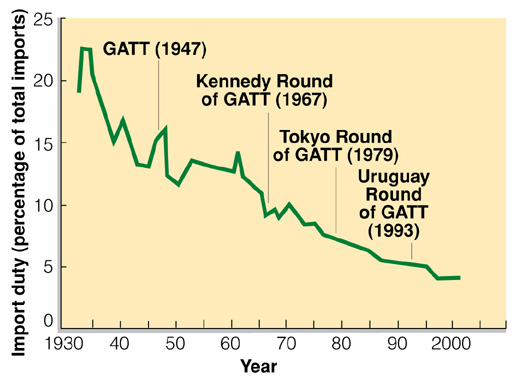
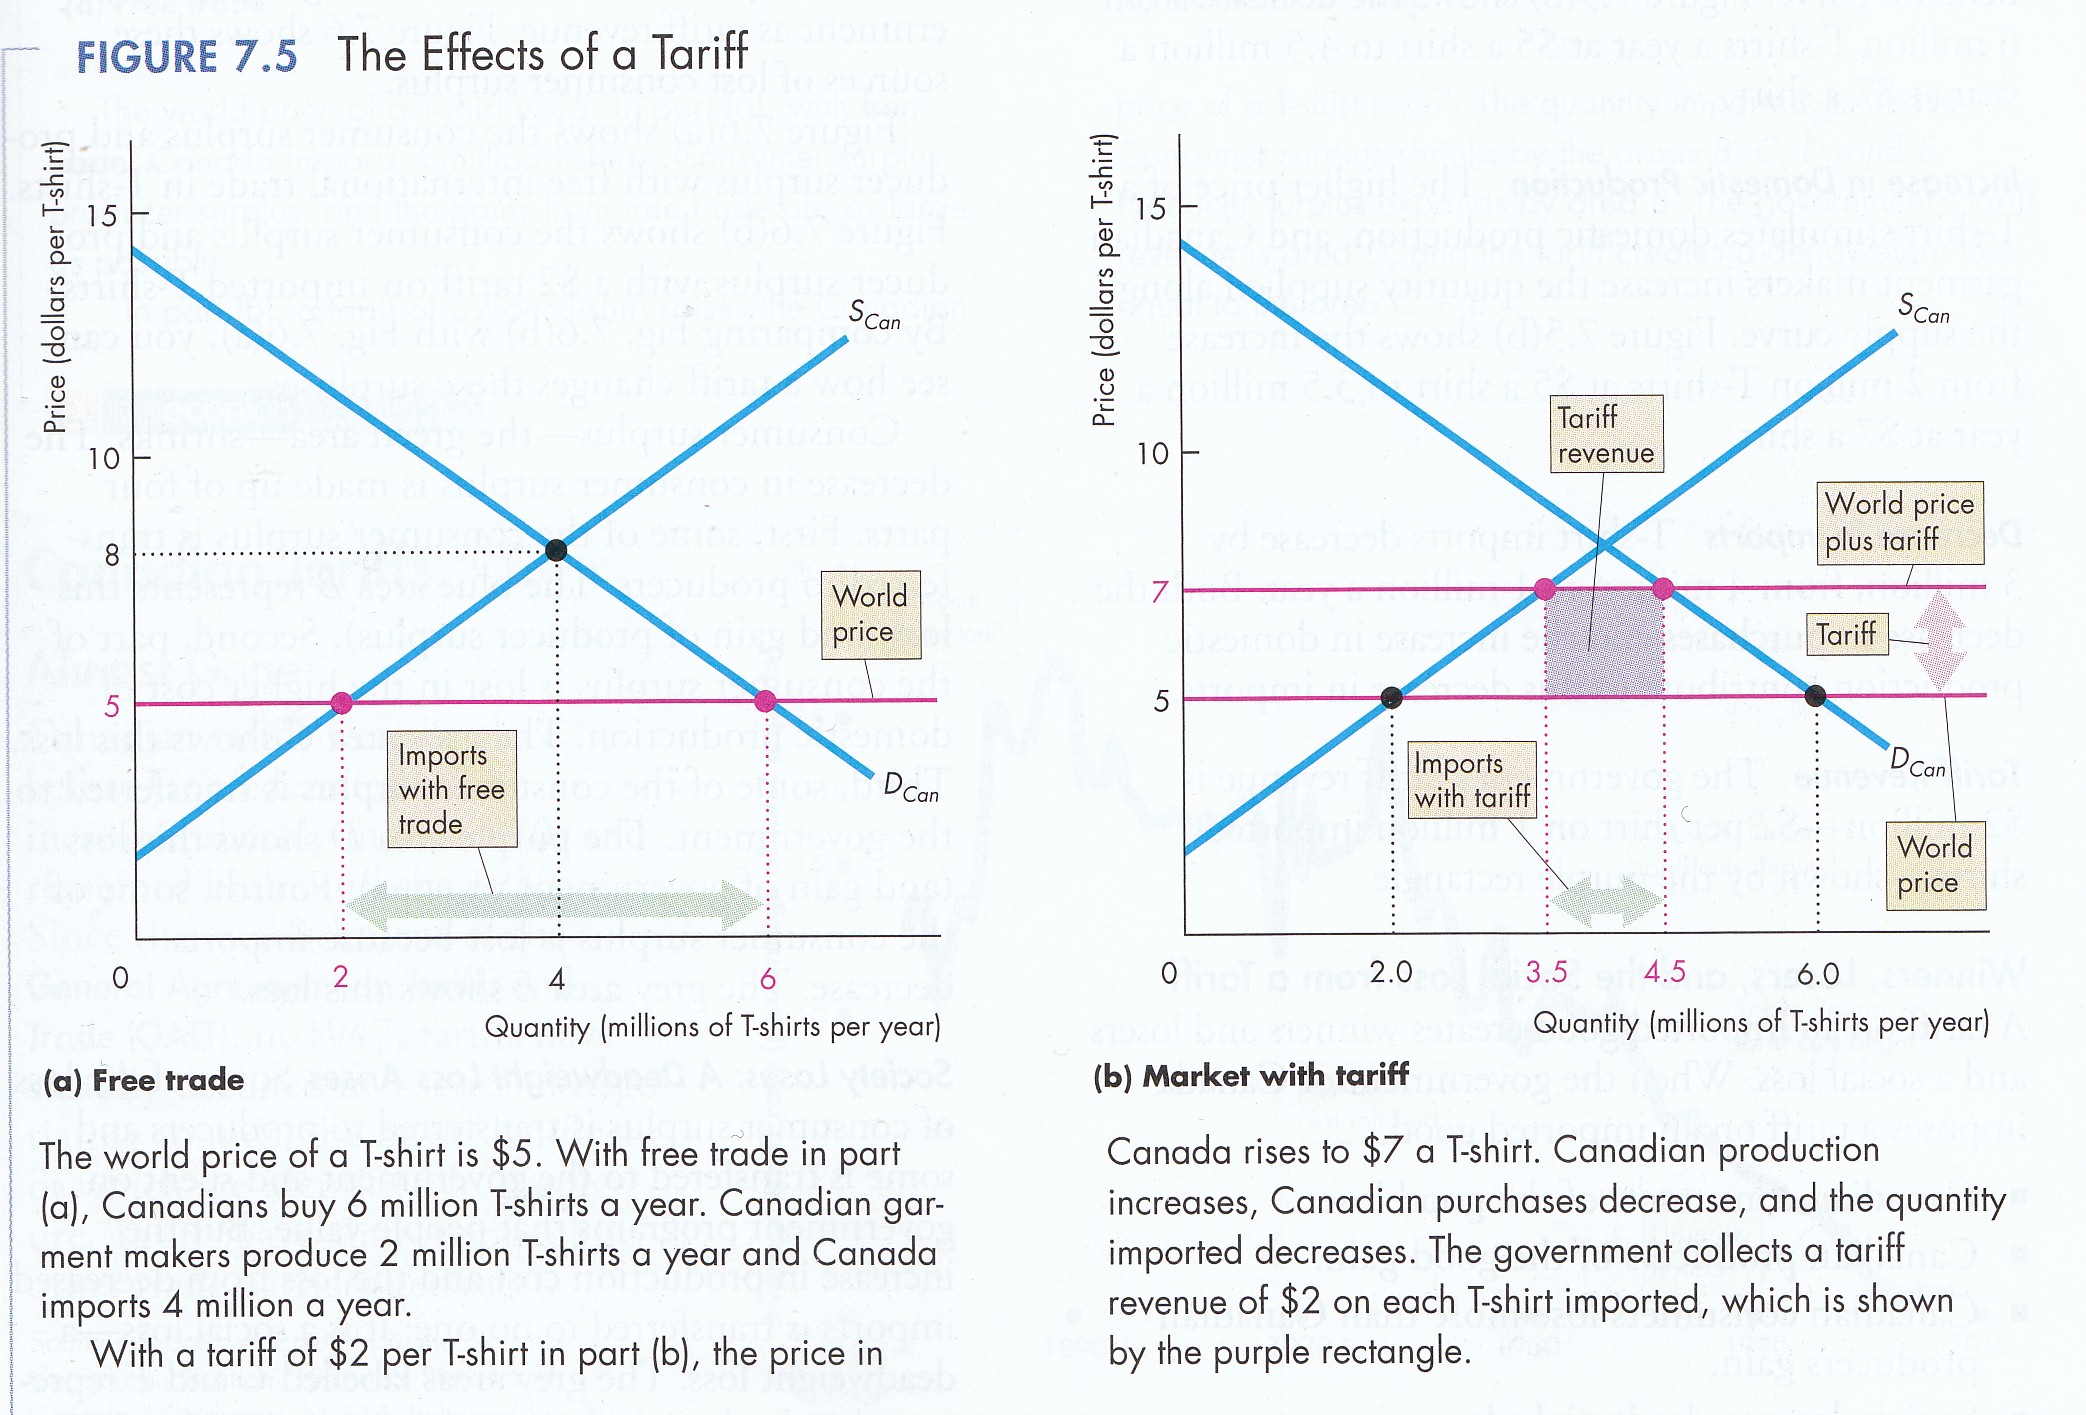
3. Free, Fair & Sanctioned Trade and Restrictions (MKM Ch. 13, 318; 299; 309) Prior to WW II the global economy was dominated by Nation-States and European colonial empires seeking autarky or self-sufficiency in both production and consumption. To protect or develop (infant industry argument) domestic producers Governments erected trade barriers in the form of tariffs and quotas. A tariff is a per unit tax imposed on imported goods. It is collected by the Government and, prior to the war, tariffs were a major public revenue source. Quotas, on the other hand, are quantitative limits on how many units of a good may be imported. No revenue is collected by the Government. Rather, importers buy at world price but, due to restricted supply, sell at a higher price pocketing the profit. During the Great Depression countries threw up tariff and quota barriers while subsidizing the exports of domestic producers. This was known as the 'beggar thy neighbour' policy. With the end of WW II the market economies agreed on the General Agreement on Tariffs and Trade (GATT) in 1947. While the Communist world formed the Council for Mutual Economic Assistance (COMECON) and traded on a material balances basis, GATT members were market economies. As will be seen with creation of the WTO in 1995, virtually all national economies were or became market economies, e.g., the People’s Republic of China joined the WTO in 2001. With GATT countries began a long process of reducing both tariffs and quotas to gain the benefits of trade for their consumers. The diagram below shows the decline in tariff s.a) Tariffs (MBB Fig. 16.9; P&B 7th Ed Fig. 7.5 & 7.6)
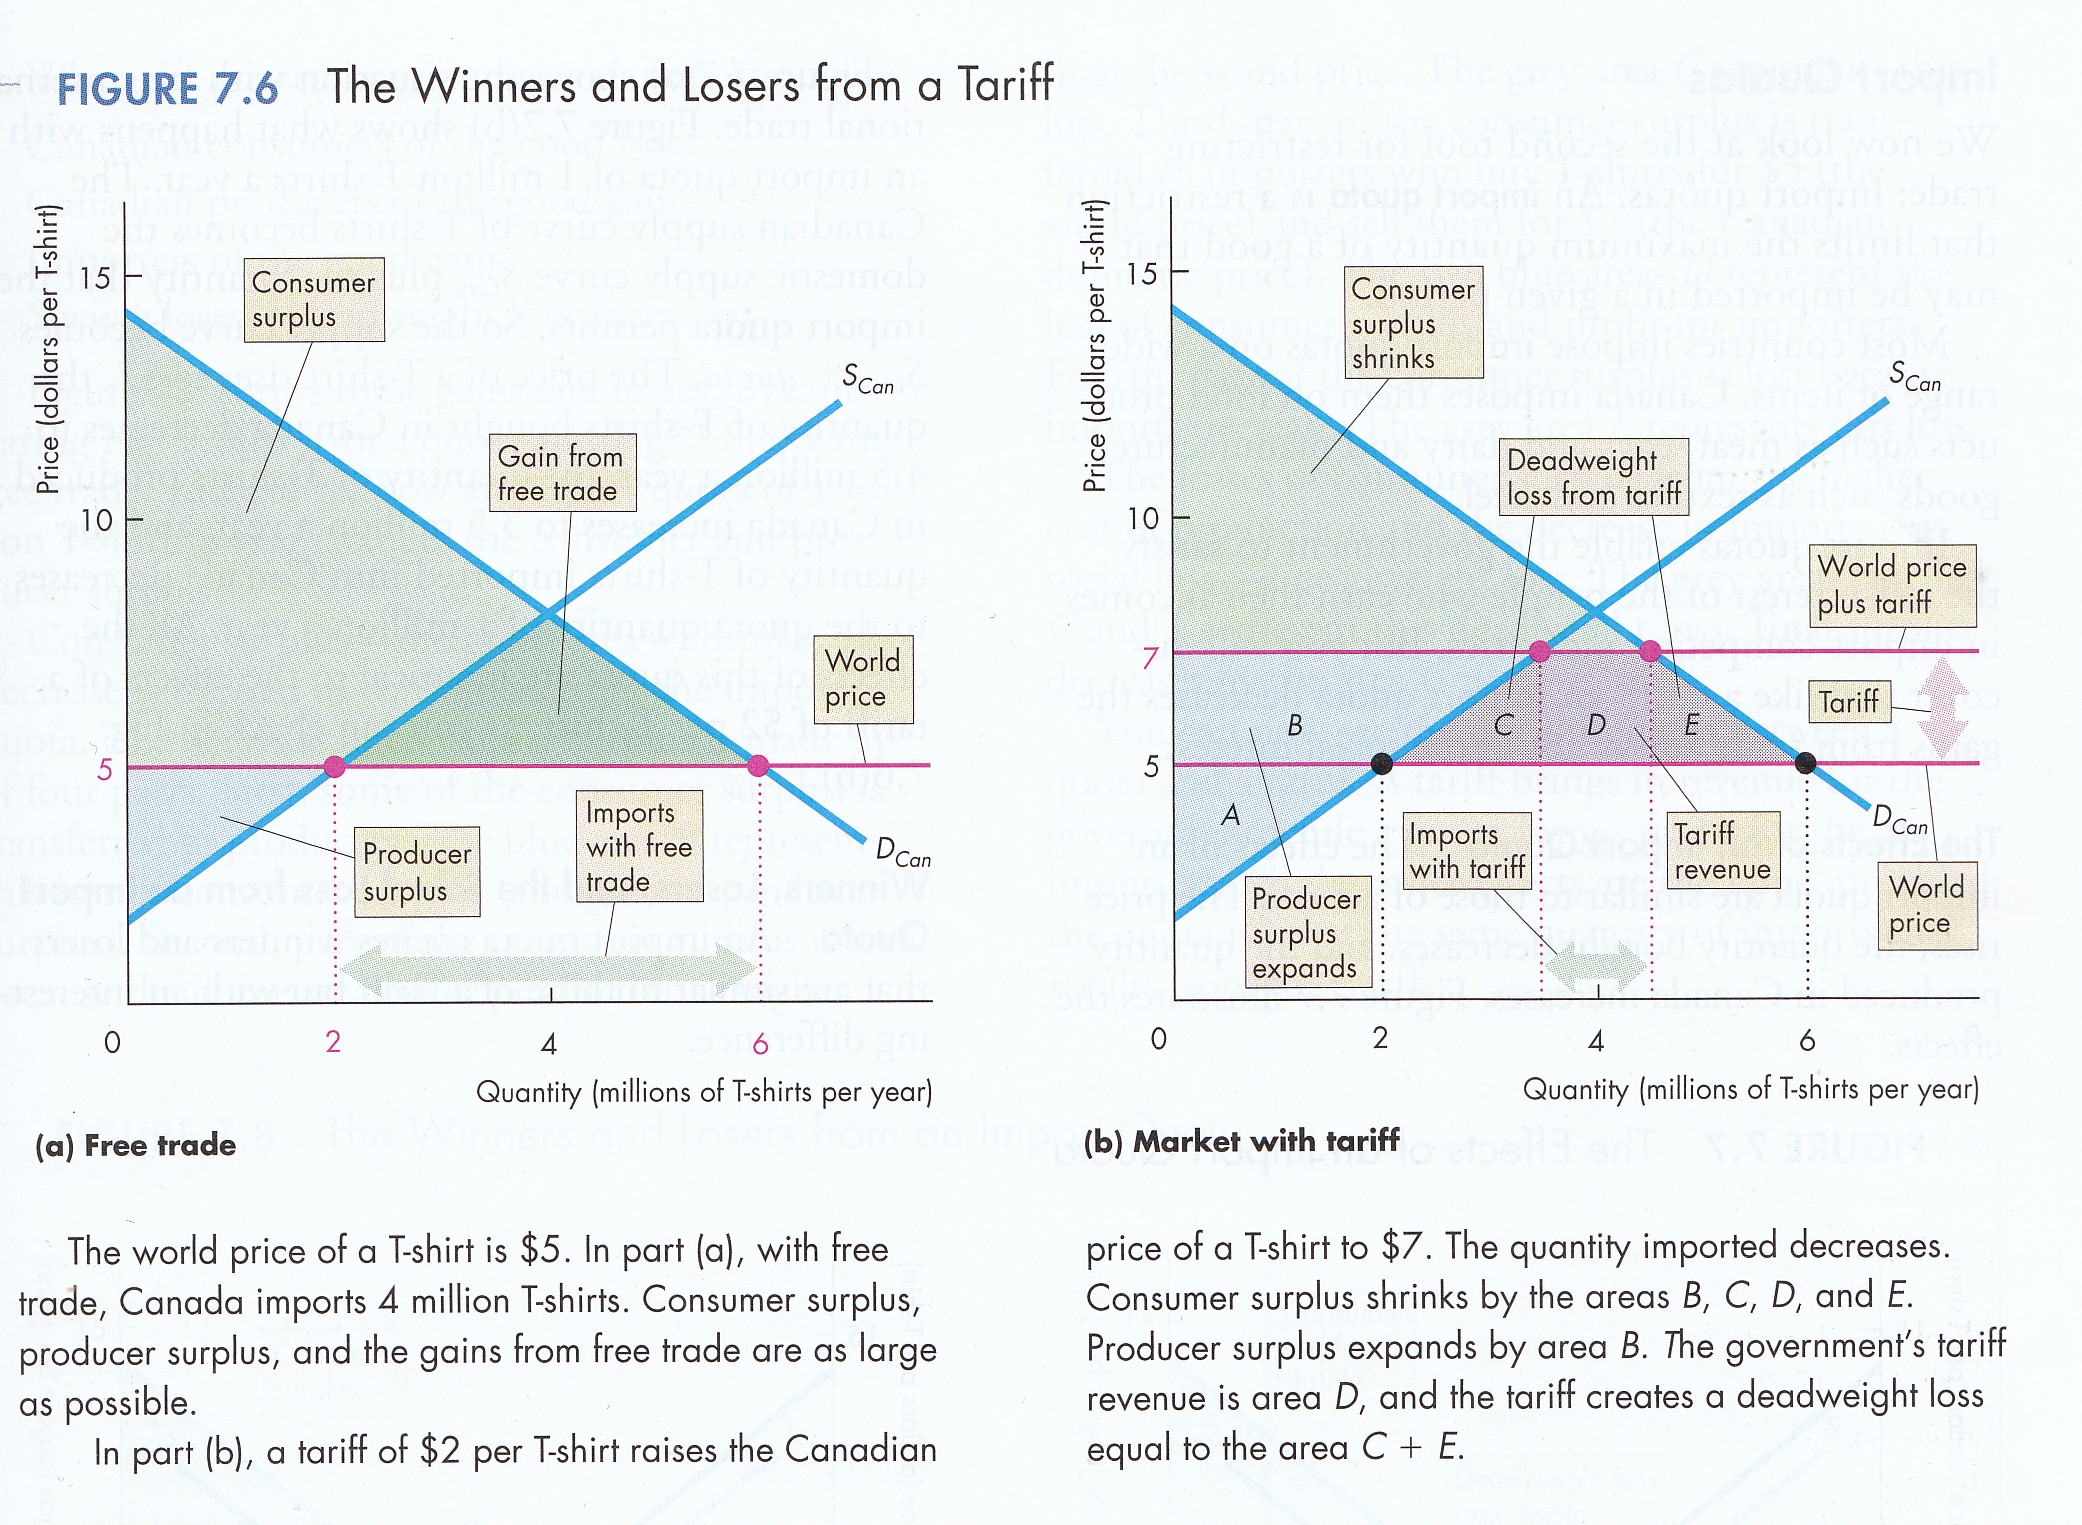
Let us examine the impact of tariffs and quotas. First, tariffs. Consider Fig. 7.5 (a). World price is $5, opposed to an $8 price for domestic product. At that price demand is 6 million units as opposed to 4 million without trade. The consumer benefit is obvious. But what about domestic producers? It should be recalled that the blue Supply Curve displayed is a horizontal summation of how much each domestic firm is willing to produce at each price and break even in the long run. Domestic firms that can compete are those below the $5 price. Other domestic firms are forced out of business. While the consumer benefits of free trade are obvious but diffuse the costs are borne directly by domestic producers and their employees who do not want to go out of business or lose their jobs. In response to lobbying by the afflicted Government imposes a $2 per unit tariff displayed in Fig. 7.5 (b). In effect this raises the domestic price to $7 per unit. Domestic producers between $5 and $7 can stay in business. Consumer, however, now pay more than world price and the benefits of trade are reduced. With the tariff 1 million units are imported and the Government earns $2 million in revenue (the grey rectangle). Fig. 7.6 shows the winners and losers from a tariff. Deadweight loss is not, however, testable
.
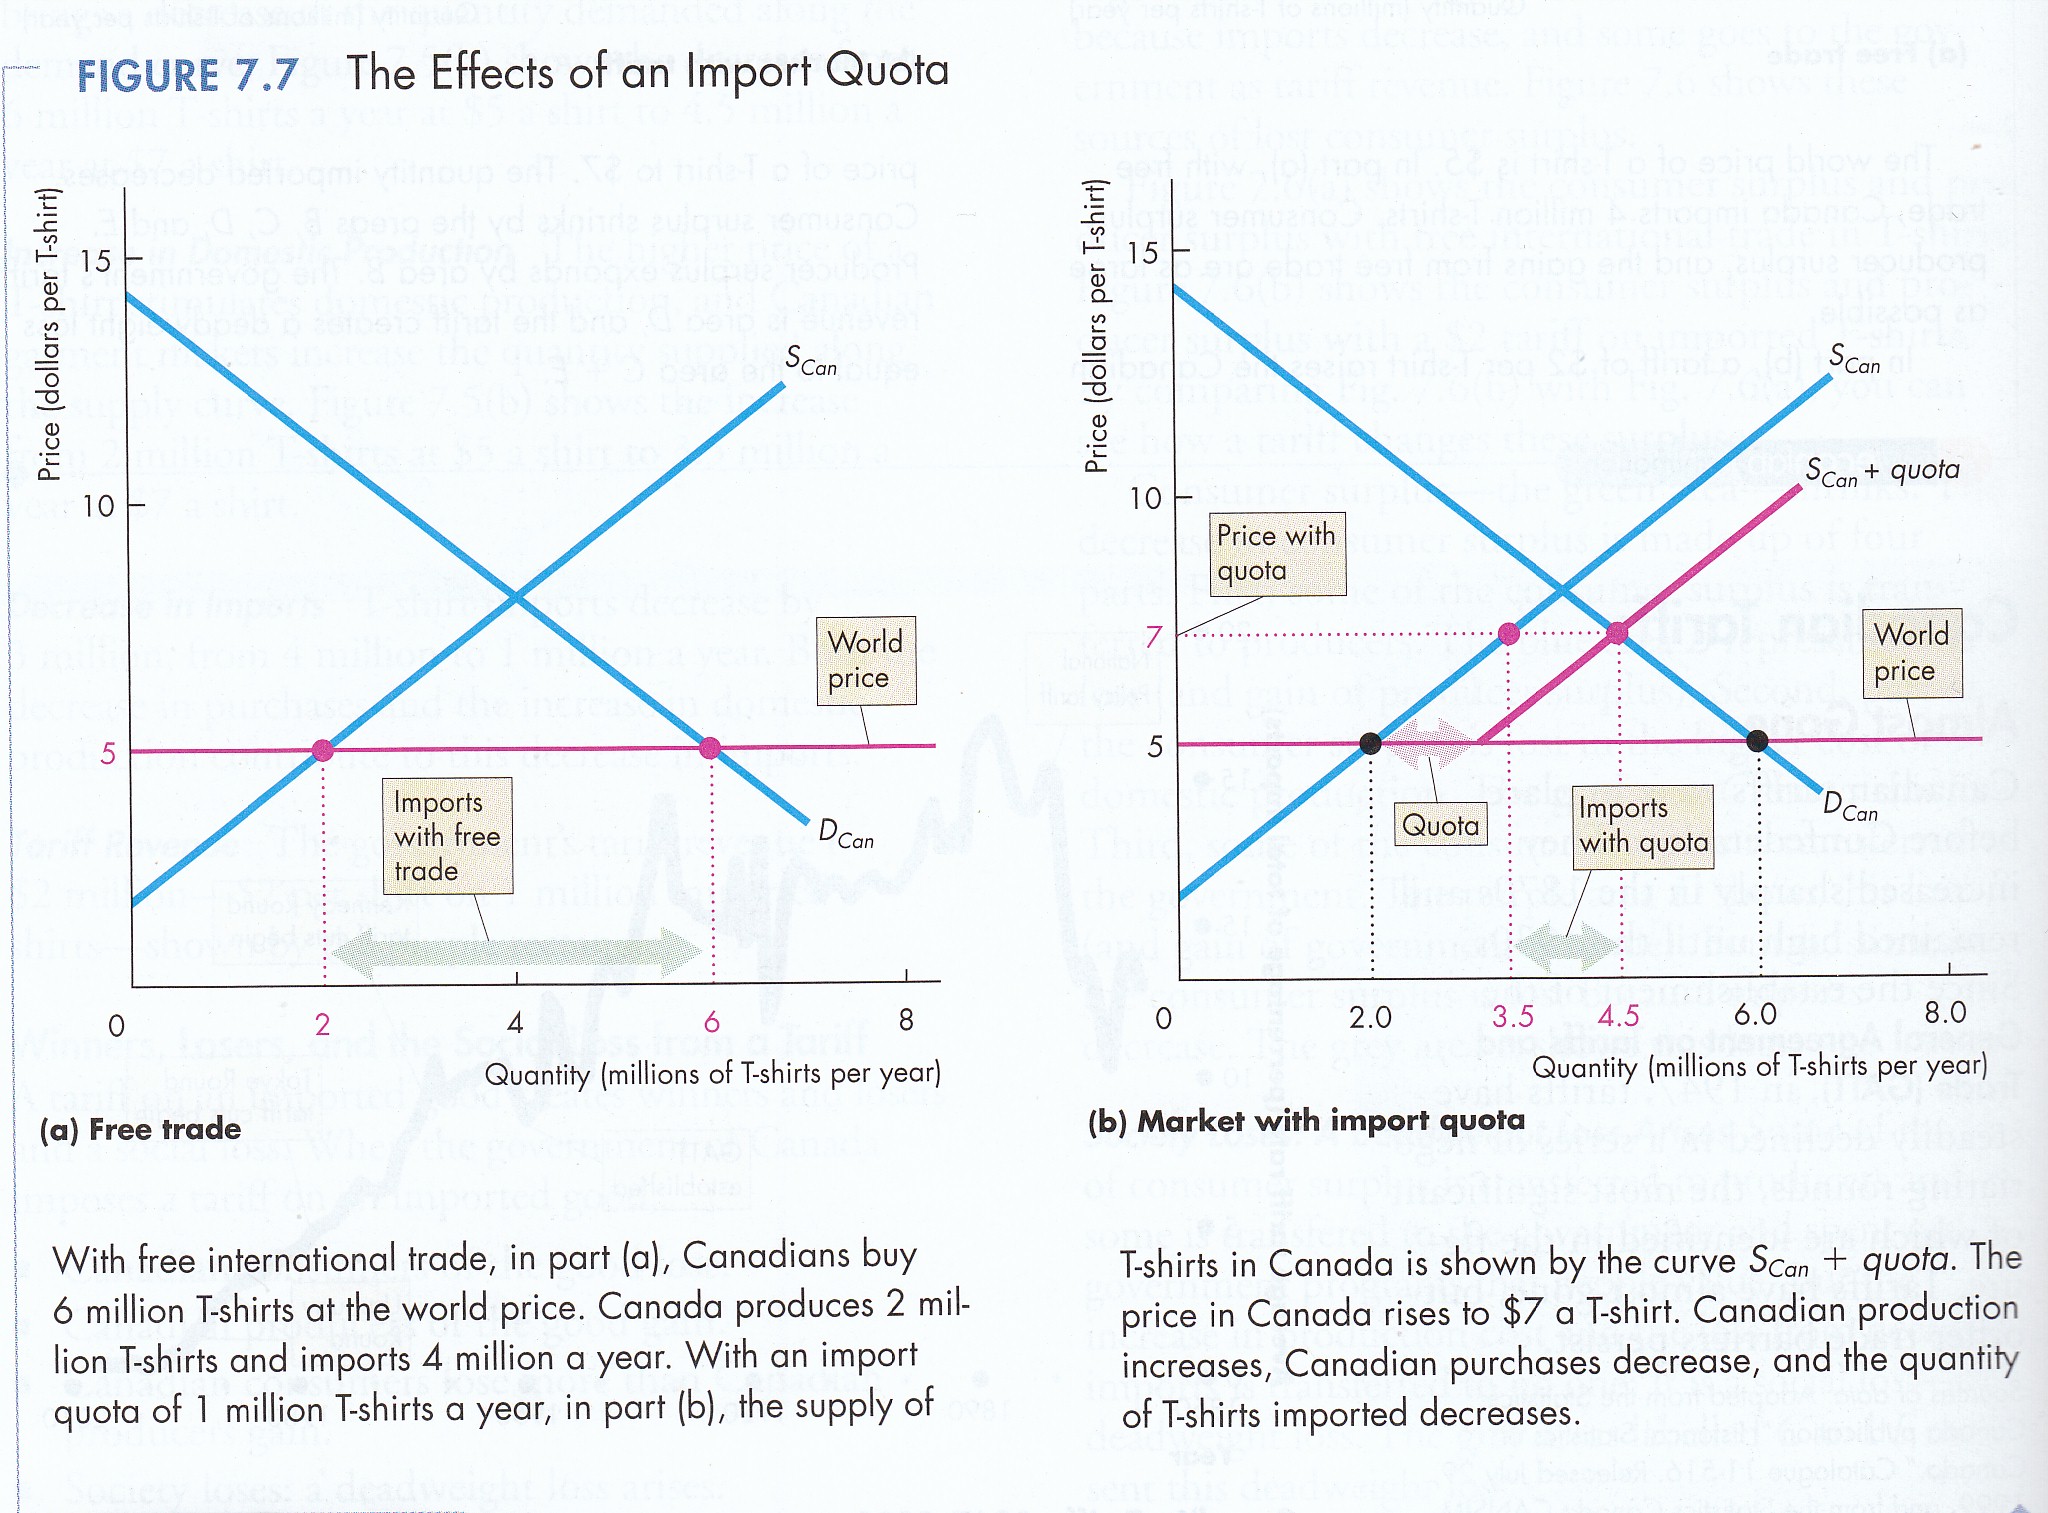
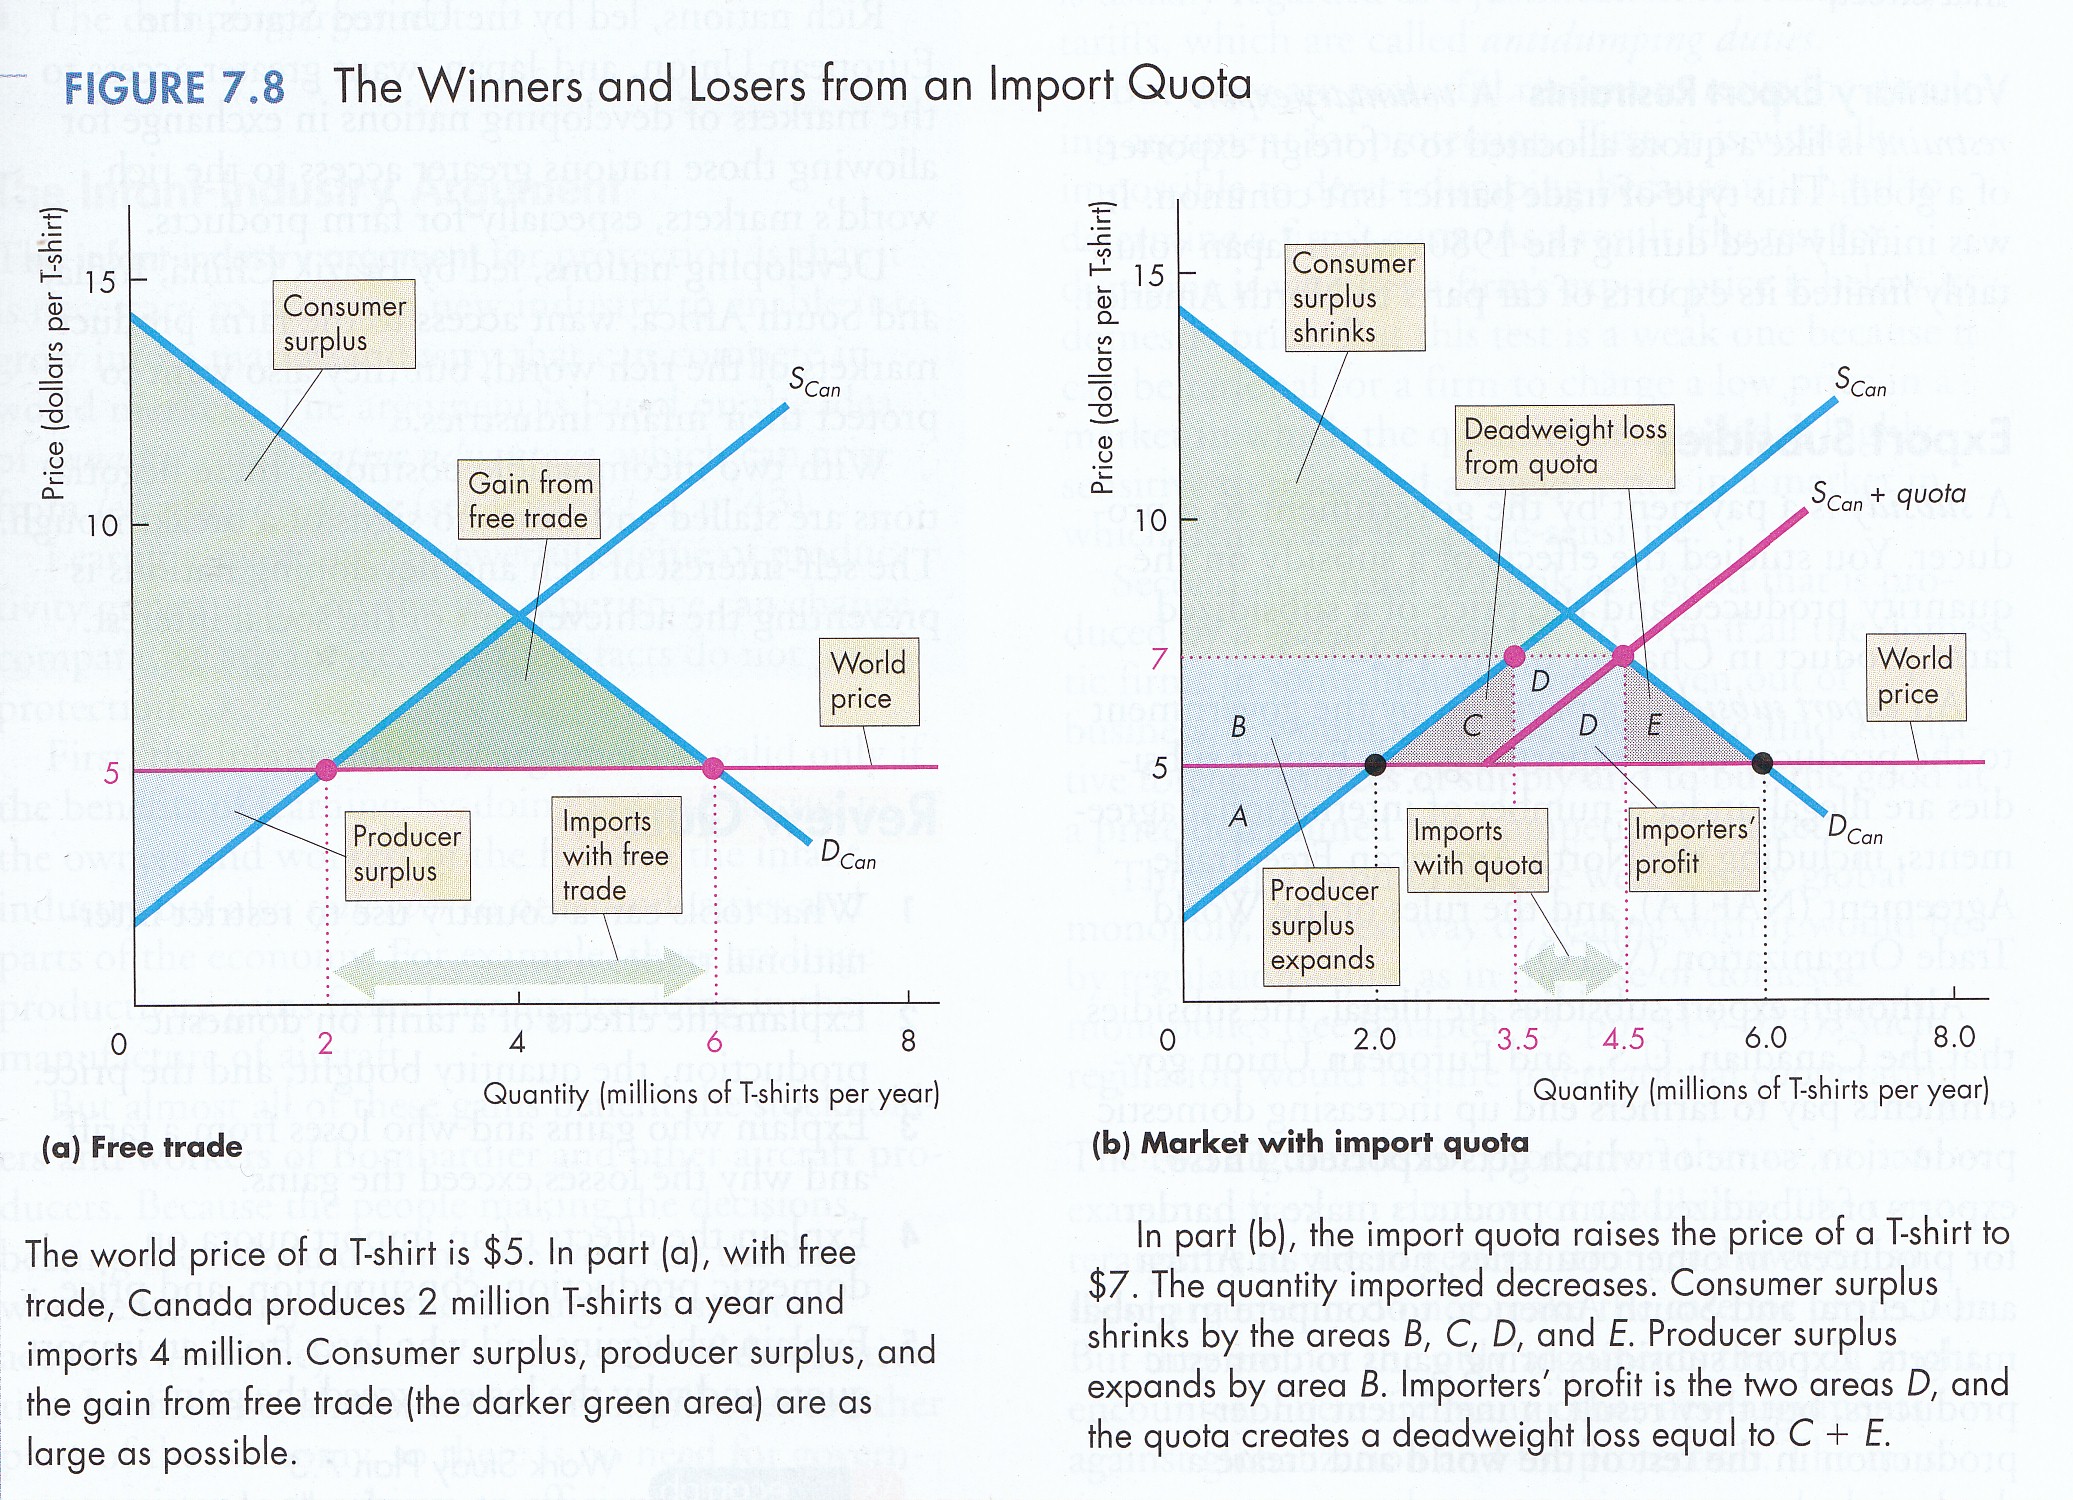
b) Quota (MKM Ch. 13, 318; 299; 309)And now, quotas. Consider Fig. 7.7 (a) & (b). Under free trade the outcome is world price $5 as opposed to an $8 price for domestic product. At that price demand is 6 million units as opposed to 4 million without trade. The consumer benefit is obvious. But what about domestic producers? Again, the blue Supply Curve displayed is a horizontal summation of how much each domestic firm is willing to produce at each price and break even in the long run. Domestic firms that can compete are those below the $5 price. Other domestic firms are forced out of business. Again while the consumer benefits of free trade are obvious but diffuse the costs are borne directly by domestic producers and their employees who do not want to go out of business or lose their jobs. In response to lobbying by the afflicted Government imposes a quota of 1 million units displayed in Fig. 7.7 (b). In effect this raises the domestic price to $7 per unit by shifting the supply curve to the right, i.e., a limited increase in supply. Domestic producers between $5 and $7 can stay in business. Importers buy at world price ($5) but sells domestically for $7 pocketing the profit. Consumer, however, now pay more than world price and the benefits of trade are reduced. Fig. 7.8 shows the winners and losers from a tariff. Again, deadweight loss is not, however, testable. The trend to free trade resulting in tariff and quota reductions to maximize the benefits of trade seemed unstoppable until the Trump presidency. Many textbooks have thus reduced consideration of tariffs and quotas to one line definitions. They were considered obsolete. P&B 7th Ed Fig. 7.7 & 7.8)
c) Non-Tariff Barriers: Not Testable As tariffs and quotas fell alternative forms of trade restrictions flowered. These included restrictions based on, among other things, culture, environment, health, national security, product standards and public safety. All are, relative to the hard dollars & cents of tariffs and quotas, vague, amorphous terms open to interpretation and game playing. Similarly, definition of ‘subsidy’ continues to elude the World Trade Organization (WTO). In the face of such non-tariff barriers the WTO is, as of March 2020, grinding to a halt. A new era in international trade is dawning. The era of ‘free trade’ defined as tariff and quota free trade is over. The era of ‘fair trade’ that takes account of non-tariff barriers is dawning as has the age of sanctions. Critical Global Trade Dates 1898 Spanish American War 1914-18 WWI 1933 USA Ends Gold Standard & Hitler Comes to Power 1939-45 WWII 1944 Breton Woods, Institutional Architecture of International Trade & Finance and Return of Gold Standard Cold War 1945-1991 1991 Collapse of the Soviet Union 2001 China enters WTO, BRICS & Shanghai Cooperation Organisation 4. The WTO, the Global Knowledge-Based Economy & BRICS Not Testable In 1995 the World Trade Organization (WTO) began operations and a new global economy was born. Today, 2018, virtually all member states of the United Nations (UN) belong to the WTO. Put another way, global regulation by the UN of political and military competition in 1945 was extended to global regulation of economic competition by the WTO fifty years later. This was possible only because of the global triumph of the Market over Marx. In this regard, formation of the WTO arguably represents the high water mark of international influence and power of the United States and its market economy. For the first time, virtually all nation-states agreed to abide by common rules of trade recognizing the WTO as final arbitrator of disputes and authorizing it to sanction countervailing measures against offenders of its rules. Given the historical role of trade disputes fuelling international conflict, the WTO compliments the UN as a bulwark of international peace, law and order. A key question not answered by the WTO Treaty is the definition of a 'subsidy' and 'national security'. Disputes between Member States are settled by a tribunal of experts in the matter in dispute. If an offending Member is found to have broken WTO rules and a complaining Member has suffered damages then countervailing tariffs equal to the assessed damages may be placed on imports of the offending Member. Such 'countervails' can be selectively applied to any imports from the offending Member. As an international legal instrument, the WTO is a ‘single undertaking’, i.e., it is a set of instruments constituting a single package permitting only a single signature without reservation. One of these instruments is the Trade-Related Intellectual Properties and Services Agreement (TRIPS, WTO 1994) that constitutes, in effect, a global agreement on trade in knowledge, or more precisely, in intellectual property rights (IPRs) such as copyrights, patents, registered industrial designs and trademarks. TRIPS is, however, but one part of the complex WTO package that includes the General Agreement on Tariffs and Trade (GATT) and twenty-six other technical agreements. TRIPS, in turn, exists in the context of a constellation of international agreements, conventions, covenants and treaties administered by the World Intellectual Property Organization (WIPO 1979) a special subject agency of the United Nations. TRIPS requires accession to some but not to all WIPO instruments. In turn, WIPO instruments apply only to Nations-States that accede to them. Generally, acceding States provide only ‘national treatment’ to citizens of other States, i.e., the same rights are extended as if they were nationals but the rights so extended are defined by each national legislature. This treatment contrasts with ‘harmonization’, characteristic of other WTO efforts, e.g., definition of subsidies. Currently ‘in force’ WIPO instruments, as well as TRIPS, ignore and thereby deny protection to ‘non-marketable’ intellectual property rights, e.g., aboriginal heritage rights (Farrer 1994; Chartrand 1995) including rights to traditional ecological knowledge or (TEK) as well as collective or community-based intellectual property rights in general (Shiva 1993). Such ignored rights, together with commercial rights that have lapsed through time, constitute the public domain of knowledge from which any and all may freely draw. In 1996, the Organization for Economic Cooperation and Development (OECD), whose members constitute the First World of developed, democratic market economies, published The Knowledge-Based Economy (OECD 1996). The next year the OECD published guidelines for competitiveness in this new economy: National Innovation Systems (OECD 1997). Creation of the WTO and recognition of the knowledge-based economy by the OECD initiated an avalanche of change. Almost immediately, rapid institution building began, continuing to this day, in public and private sectors around the world. A new specialty emerged – ‘knowledge management’, not to be confused with its predecessor - information management; the ‘Chief Knowledge Officer’ (CKO) is becoming an hierarchical feature of multi- and trans-national corporations; governments are creating knowledge ministries, departments and agencies; ‘knowledge audits’ are being conducted by firms and nation-states around the world (Malhorta 2000); and, nation-states themselves are designing ‘national innovation systems’ (NIS) to generate and market new knowledge (OECD 1997). Even a standardized lexicon or vocabulary is being drafted to guide public and private sector discussion and debate (American National Standards Institute and the Global Knowledge Economics Council 2001). Only time will tell whether all this conceptual and institutional activity is a passing policy fad or marks a true evolutionary leap in economic development and thinking. What is certain is that knowledge is now recognized as a strategic asset in the competitiveness of nations. What is equally certain, however, is that the ‘Standard Model’ of economic thought is theoretically inadequate to deal with this new economy. Non-linked references Farrer, C.,“Who Owns the Words? An Anthropological Perspective of Public Law 101-601,” Journal of Arts Management, Law and Society, Winter 1994, 317-326. Samuelson, P.A., “The Way of an Economist,” in P.A. Samuelson, ed., International Economic Relations: Proceedings of the Third Congress of the International Economic Association, Macmillan, London, 1969. Shiva, V., Monocultures of the Mind: Understanding the Threats to Biological and Cultural Diversity, Inaugural Hooper Lecture, Centre of International Programs, University of Guelph, September 21, 1993. Wilson, M., “Address to the Canadian Bureau for International Education,” July 14, 1992.
|