What I call the Standard Model of Market
Economics did not just appear. Rather it evolved over some 70 years
between the 1870s and 1940s. For those interested in its evolution,
please see Observation #1: Origins. The model employs many
concepts (from the Latin: to grasp firmly with the hand). To introduce its construction, operation and critique, I
present, in brief, some of the most critical. These are the 'tools
of the mind' we will use through out the course.
1.
Scarcity, Choice &
Opportunity Cost (MKM C1/4–6:
2-4;
2-4;
2-4)
Without Scarcity there would be no Economics. Scarcity is that
permanent human condition in which our wants, needs and desires always
and forever will exceed the means available to satisfy them.
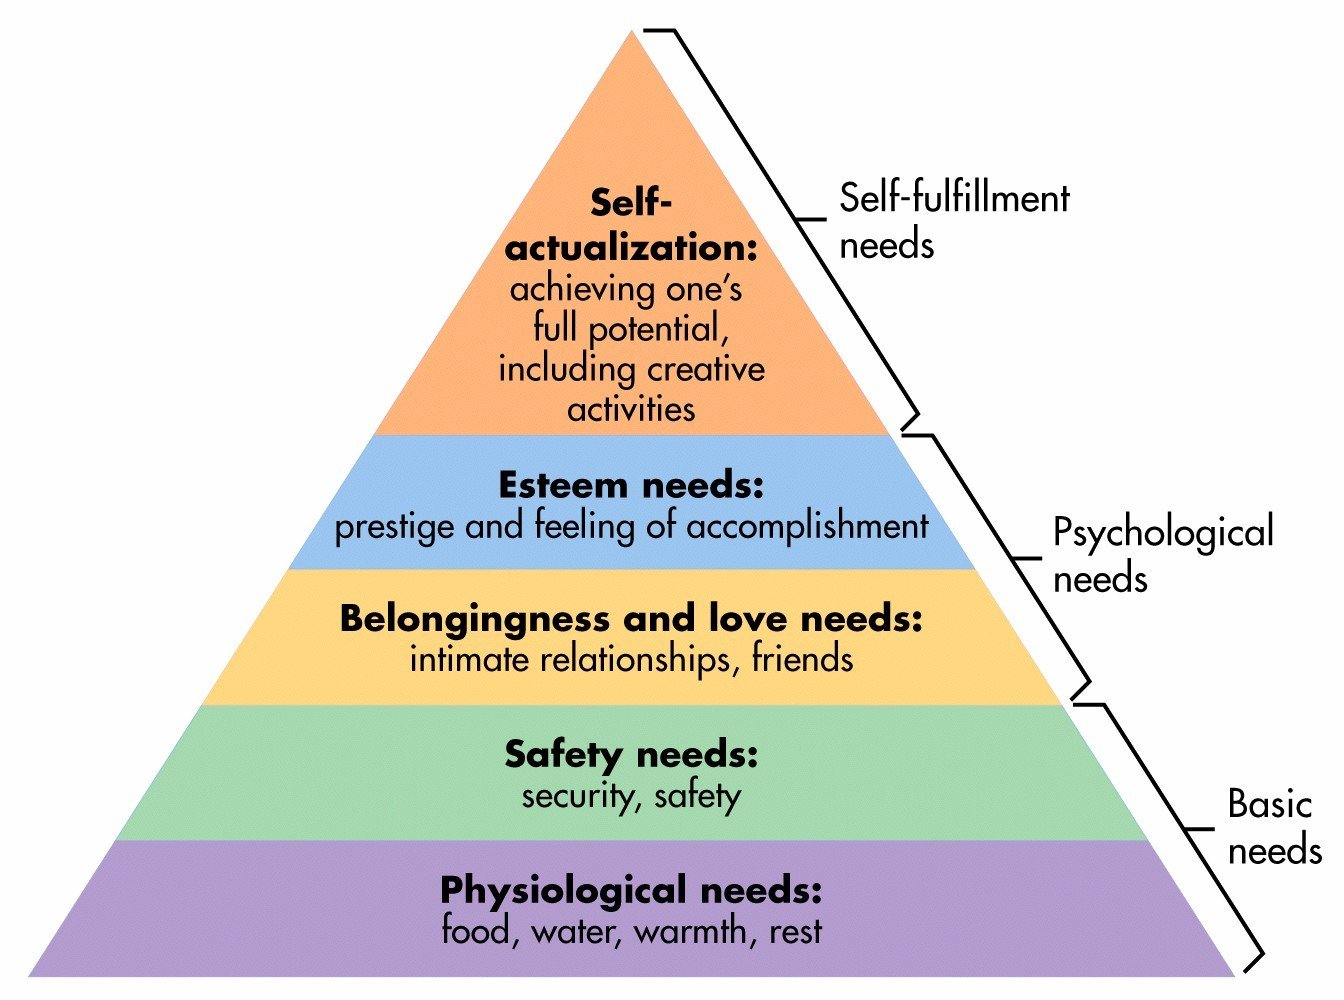
Mainstream economics does not differentiate between wants,
needs and desires. As will be seen this is similar to mainstream
economics treatment of different kinds of knowledge. Wants, needs and desires,
however, can be defined using
Maslow's
Need Hierarchy.
Accordingly, we must choose between alternative ways of maximizing our
satisfaction. Economics has in fact been called the science of choice.
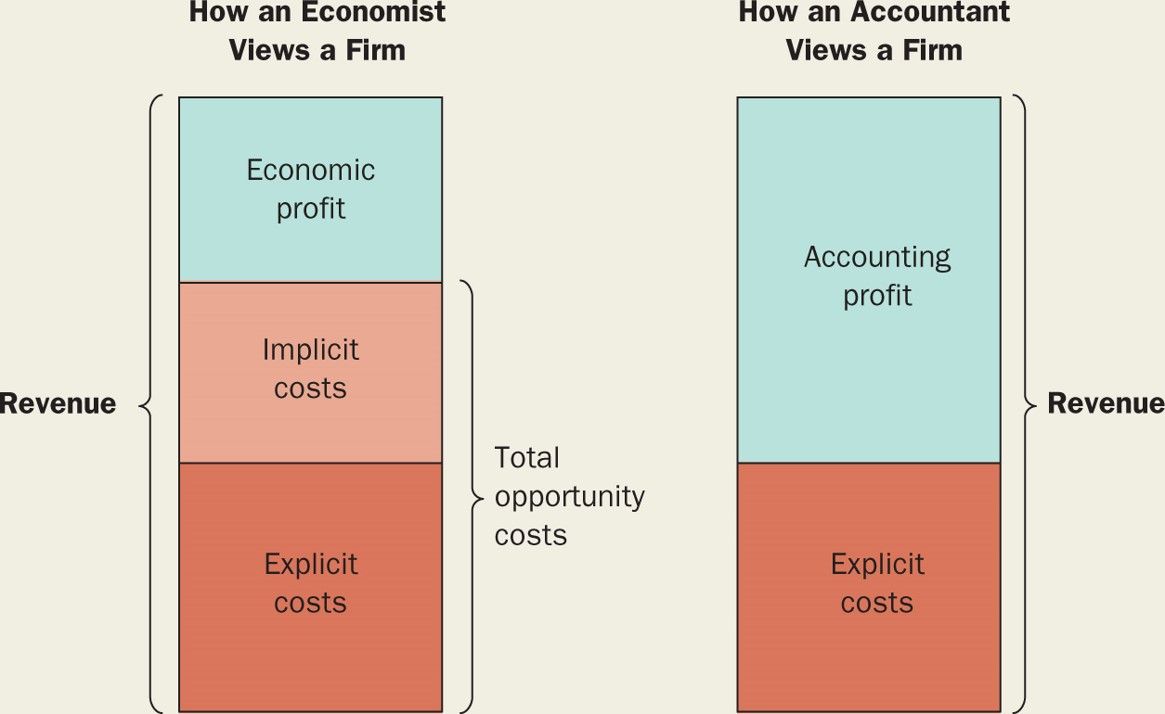
In choosing one alternative over all other alternatives we give up the
next best alternative. This is the opportunity cost of choice –
the next best alternative forgone. In
Economics all costs are opportunity costs. This concept distinguishes
Economics from accounting, business and commerce
(MKM Figure 13.1):
Quite simply, without Scarcity there is no need for Economics, no need
to choose. You can have everything! Scarcity is the prime
directive of Economics.
In
Microeconomics, it involves allocation of scarce resources by consumers
and producers; in Macroeconomics, allocation of scarce resources by
market price and the State.
Market price measured in dollars, euros, pounds,
renminbi, yen, etc., are useful but do not necessarily reflect
the 'real cost' of a good or service. Take the opportunity cost of work. If one works an hourly job, one is paid a wage
per hour that multiplied by hours worked equals income, e.g., 4
hours @ $10 an hour equals $40 of income. This does not, however, allow for
the opportunity cost associated with preparing for, then re-creating after, work
including commuting both ways, e.g., 2 hours. The real wage per hour
is now $40 of income divided by 6 not 4 hours or $6.67 per hour.
We can also determine opportunity cost
by calculating the 'relative price' of a good or service. Relative
price is the ratio of one price to another. For example, if the price of a
Coke is $1.00 and chewing gum $0.50 the relative price of Coke is
$1.00/$0.50 or 2, i.e. you could buy 2 packs of chewing gum for the price
of one Coke.
There
are, of course, thousands if not millions of different goods and services all with
different and changing market prices. Accordingly, relative price is usually expressed
as the price of a standard basket of goods and services measured
using a price index.
Let us say overtime we observe the same basket of goods and
services cost $100 in 2001 but $110 in 2011. In this case, we divide the monetary price
in 2011 by the price in 2001 finding the price went up 10%.
Such a basket of goods & services represents a measure of our well
being. Relative to 2011 this means we need to earn 10% more income to maintain our
standard of living. The currency has suffered inflation - the same
number of dollars buys less than before. By contrast, if the price
change reversed, $110 in 2001 but $100 in 2011 then the currency has
deflated - less buys more.
In
microeconomics, price means 'relative price' of specific goods &
services. Thus when the price of a good or service falls, we do not mean
its monetary price but rather that price relative to other goods and services, i.e. it's
opportunity cost falls. In macroeconomics concern focuses on the
aggregate price level of all goods & services within a
national economy. The question of international prices
is even more complicated. The income of a salaried executive
in Saskatoon supports a certain standard of living. To maintain
that standard in Hong Kong or London or New York or Singapore or Tokyo
how much would one's income have to increase?
One widely used measure of purchasing power parity is the 'Mac
Index' which measures the number of hours of work required to buy a 'Big Mac' in different
countries.
2.
Expectations/Futurity/Time
(MKM C4/73 & 78:
68 & 73;
70 & 75;
69)
Choice, however, involves more than here
and now. Time plays multiple roles in Economics. First, there
is static and dynamic analysis. Static involves a fixed moment in time;
dynamic involves analysis of Past to Present to Future.
Second,
John Maynard Keynes uses the term ‘expectations’. People’s changing
expectations of tomorrow alters their actions today. John R. Commons
uses the term ‘futurity’ meaning people live in the future but act in
the present. What we expect tomorrow determines what we do today.
Deferred gratification, i.e., waiting for tomorrow, is the source
of savings - deferred consumption.
Third,
there is the very short run, the short run and the long run. In the
very short run the quantity of all inputs (Capital, Labour and Natural
Resources) is fixed, so is output. In the short run at least one factor
of production is fixed (usually Capital), while others (usually Labour
and Natural Resources) are variable. In the long run all factors are
variable. These time periods are functional, not chronologic. The long
run for a new Tim Horton’s is 6 months to a year but 10 years or more
for a steel mill, hydro dam or nuclear power station.
3.
The Big ‘M’ & Constrained Maximization
(MKM C1/7-8: 4-6;
4-6;
4-6)
The question becomes: How to choose? Flip
a coin? Consult the spirits? Decision making in the Standard Model is
done at the ‘margin’. In daily conversation marginal means
unimportant. In Economics marginal defines the choice point. The
marginal unit is the last grain of sand tipping the balance. In
Newtonian calculus of motion the marginal is the derivative: first
derivative - the rate of change; second derivative - change in the rate
of change. The marginal concept defines economic choice in the Standard
Model. For example:
marginal utility: the additional
satisfaction of one more unit in consumption;
marginal product: the additional output of
one more unit input;
marginal cost: the additional cost of one
more unit output; and,
marginal revenue: the additional revenue
from sale of one more unit.
Examples in Macroeconomics include:
marginal propensity to consume: the part
of an additional dollar in income spent on consumption;
marginal propensity to save: the part of
an additional dollar in income retained as savings;
marginal propensity to import: the part of
an additional dollar in income spent on imported goods & services; and,
marginal tax rate: the part of an
additional dollar in income taken in taxes.
As will be seen economic choice involves
constrained maximization. Thus a consumer in striving to maximize
happiness is constrained by income and price. Similarly when a firms
strives to maximize profits it is constrained by existing technology,
input costs and the revenue earned for the output. All decisions
made at
'the margin'.
4.
Geometry, Calculus & Symbolic Equations
(MKM C2/39-47:
35-45;
36-47;
34-42)
Geometry is the West’s unique contribution
to Mathematics. In the hands of Euclid, Archimedes and Ptolemy the
ancient Greeks used universal forms of the circle, square, triangle and
their variations, e.g., the parabola, to explain two- and
three-dimensional space including movement of the stars. Those
interested in further detail, please see
Observation #2: Geometry.
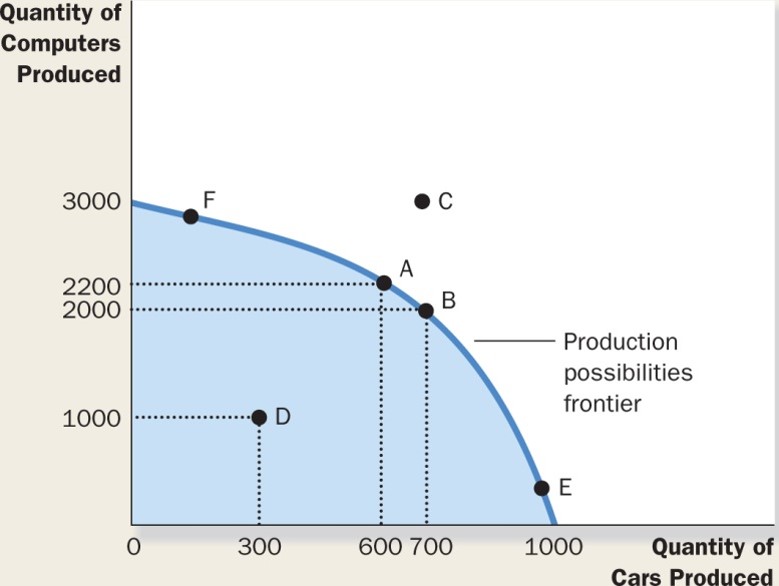
At the beginning of the European
Enlightenment & Scientific Revolution Rene Descartes (1596-1650) introduced analytic geometry
using a coordinated two-dimensional space defined by two axis: the
X-axis or abscissa and the Y-axis or ordinate defining the location of
every point, e.g., (600, 2200) a point 600 units to the right and
2200 units up. [MKM Fig. 2.2].
 Analytic geometry has since been extended to
n-dimensional space. In this course you will make extensive
use of what Alfred Marshal, father of the Standard Model,
began developing in 1867: “diagrammatic economics”. Keynes, in
his 1924 obituary to Marshal, noted that “such diagrams must surely form
a part of every advanced course in economics, and they should be
available for students in the fullest and clearest form possible.” I
argue that what was true for ‘every advanced course’ in 1924 is true for
an introductory courses in 2020.
Analytic geometry has since been extended to
n-dimensional space. In this course you will make extensive
use of what Alfred Marshal, father of the Standard Model,
began developing in 1867: “diagrammatic economics”. Keynes, in
his 1924 obituary to Marshal, noted that “such diagrams must surely form
a part of every advanced course in economics, and they should be
available for students in the fullest and clearest form possible.” I
argue that what was true for ‘every advanced course’ in 1924 is true for
an introductory courses in 2020.
In the 1670s, what was known as ‘the
geometry of infinitesimals’, i.e., geometric exhaustion, achieved
a breakthrough with the independent invention of the calculus by Newton
(1643-1727) and Leibniz (1646-1716). Calculus provided a true
mathematics of motion – changing spatial position through Time expressed
in algebraic rather than geometric terms. No calculus will be used in
this course.
Finally, a symbolic equation is a
generalized statement of a functional relationship between a dependent
and independent variables. No numbers or the nature of the functional
relation is stated. Examples in the Standard Model include:
The Consumption Function expressed as:
U = f (x, y) where:
U (dependent variable) is the utility or
satisfaction derived from consuming commodity combinations of x and y
(independent variables); and,
f
is the taste or preference function of the
consumer; and,
The Production Function of the firm
expressed as:
Q = g (K, L, N) where:
Q (dependent variable) is the output;
independent variables include:
K is Capital plant & equipment;
L is Labour; and,
N is Natural Resources.
g is technology or ‘know-how’;
Throughout the course these and other
symbolic equations will be displayed in Cartesian space defined by X-
and Y-axes coordinates.
5.
Demand, Supply & Markets
(MKM C4/67-88: 62-82;
65-86;
58-84)
Demand, Supply & Markets are the high
order concepts in both Micro and Macroeconomics. In Microeconomics it
is demand for and supply of a specific good or service. Demand reflects
the constrained maximization of happiness by a consumer faced with a
limited budget, prices and the need for other goods & services. Supply
reflects the constrained maximization of profit by a firm faced with
existing technology, input costs and revenue per unit. In
Macroeconomics it is Aggregate Demand for and Aggregate Supply of all
goods & services in a national economy. For purposes of introduction I
restrict myself to Microeconomics. The concepts, however, apply in
Macro.
i - Demand
All other things being equal, the higher
the price the lower the demand; the lower the price the higher the
demand. This is the Law of Demand. The Demand Curve [MKM Fig 4.2]
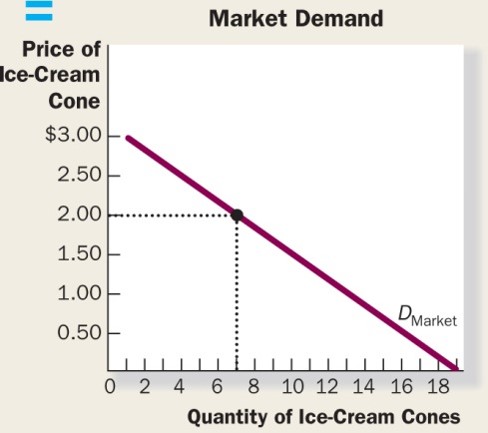 shows the relationship between price and
quantity demanded of a good or service. It shows a consumer’s
willingness to pay different prices for different quantities of a good
or service. All things being equal, the Demand Curve is downward
sloping reflecting the Law of Demand.
shows the relationship between price and
quantity demanded of a good or service. It shows a consumer’s
willingness to pay different prices for different quantities of a good
or service. All things being equal, the Demand Curve is downward
sloping reflecting the Law of Demand.
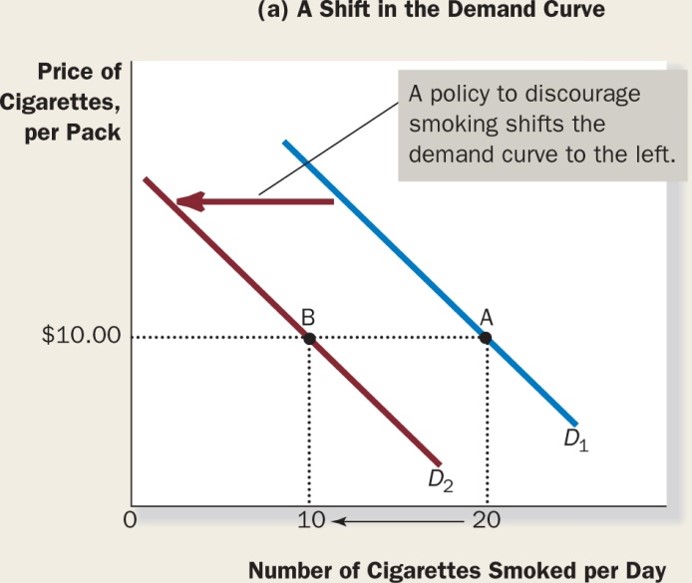
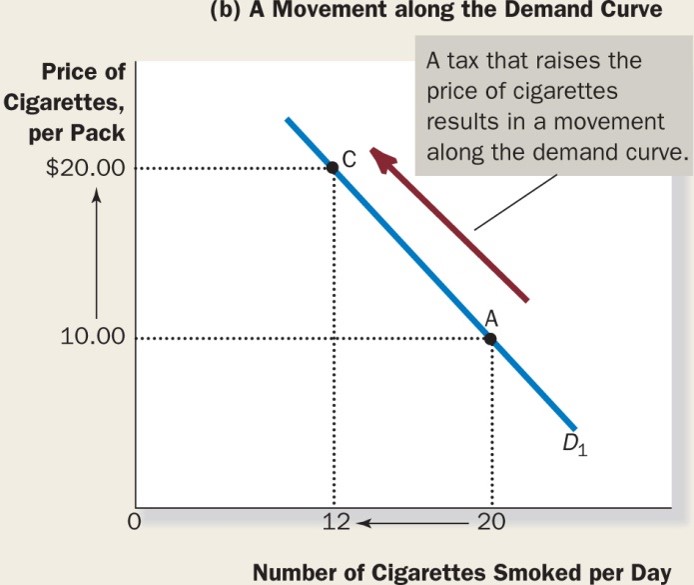
Assuming the taste of consumers, the price
of other goods & services as well as income remain constant there will
be movement up and down along the curve as price changes. If any of the
constants change, however, the Demand Curve will shift [MKM Fig. 4.4 a &
b]. In Cartesian space adding horizontally how much each
consumer is willing to buy at each price generates the Market Demand
Curve. The Market Demand Curve is thus an aggregation of individual
consumer demand curves. As will be seen, and importantly, what can
be aggregated can sometimes be disaggregated.
ii - Supply
All other things being equal, the higher
the price of a good or service, the higher the quantity supplied; the
lower the price, the lower the supply. This is the Law of Supply. The
Supply Curve [MKM Fig 4.6]
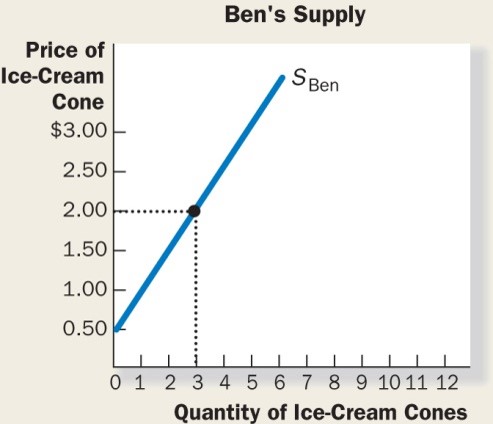 shows the relationship between price and
quantity supplied. It shows the willingness of a producer to sell. All
things being equal, the Supply Curve is upward sloping reflecting the
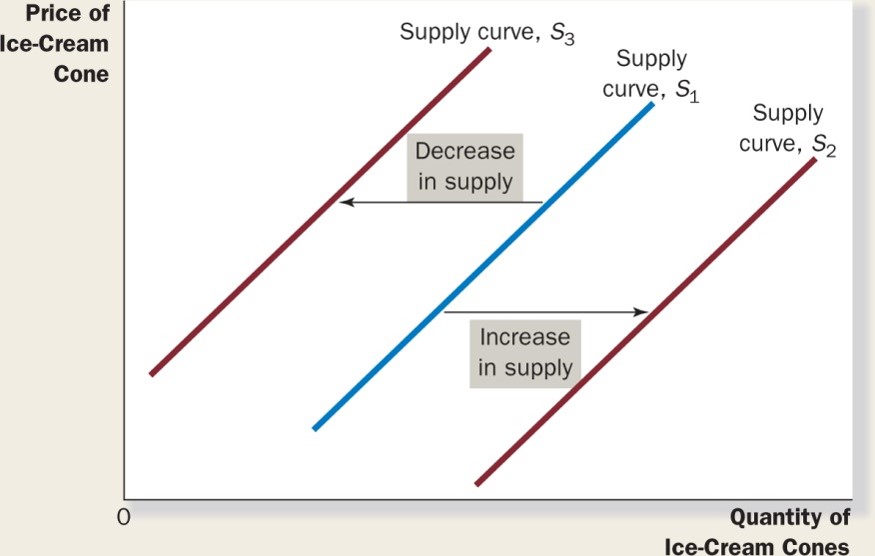
Law of Supply. Assuming the cost of inputs and technology remain
constant, there will be movement up and down along the curve as price
changes. If any of the constants change, however, the Supply Curve will
shift [MKM
C4/78, Fig 4.7]. In Cartesian space adding horizontally how
much each firm is willing to sell at each price generates the Market
Supply Curve. The Market Supply Curve is thus an aggregation of
individual firm supply curves. As will be seen, and importantly,
what can be aggregated can sometimes be disaggregated.
shows the relationship between price and
quantity supplied. It shows the willingness of a producer to sell. All
things being equal, the Supply Curve is upward sloping reflecting the
Law of Supply. Assuming the cost of inputs and technology remain
constant, there will be movement up and down along the curve as price
changes. If any of the constants change, however, the Supply Curve will
shift [MKM
C4/78, Fig 4.7]. In Cartesian space adding horizontally how
much each firm is willing to sell at each price generates the Market
Supply Curve. The Market Supply Curve is thus an aggregation of
individual firm supply curves. As will be seen, and importantly,
what can be aggregated can sometimes be disaggregated.
iii -Markets
Markets exist anywhere, in real or virtual
space, that buyers and sellers can transact business. Put another way,
Markets are where Demand meets Supply setting a price/quantity that
clears the market; ‘X’ marks the spot where the willingness to buy
exactly matches the willingness to sell [MKM Fig 4.8]. 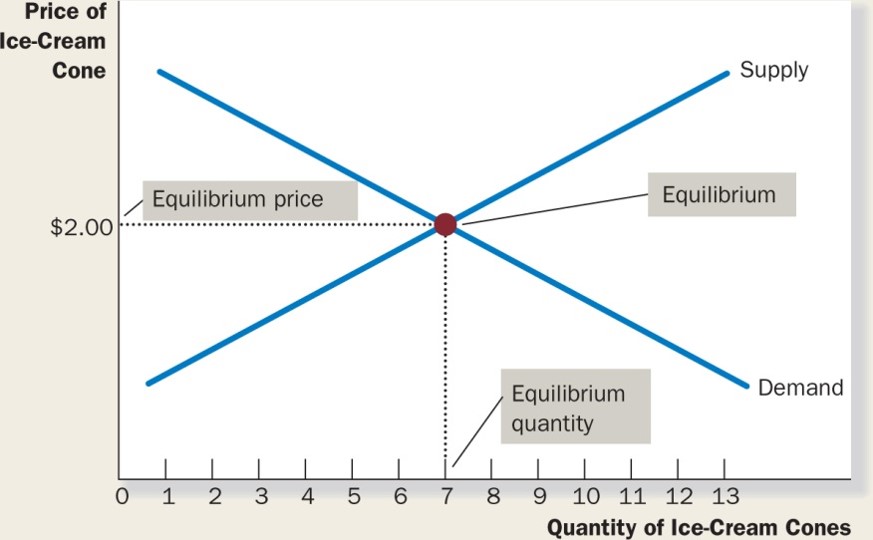 Markets can be:
- commodity-based, geographic or virtual;
- in or out of equilibrium [MKM
Fig 4.9 a &
b];
- sensitive or insensitive to changes in
price, income, taste or technology;
- influenced by someone - consumer,
producer or government - altering the price/quantity outcome by
exercising market power.
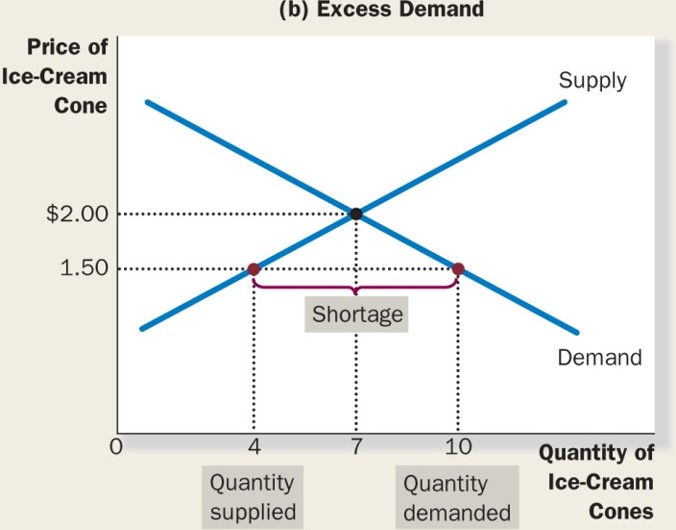
In a Market, price regulates the quantity
of goods and services demanded and supplied. If price is too high,
consumers demand less than producers are willing to supply. A surplus
exists. To rid themselves of this surplus producers lower their price.
If price is too low, consumers demand more than producers are willing to
supply. A shortage exists. To get more of the good consumers bid up
the price [MKM Fig 4.9 a &
b]. The tendency of producers to lower price faced with
a surplus and consumers to bid up price faced with a shortage is called
Market Forces. These tend to keep the market price/quantity where ‘X’
marks the spot.
6. 10 'Es' of Economics
By coincidence many of the key concepts in
Economics begin with the letter ‘e’. Here are what I consider the top
10.
i -
Efficiency
(MKM C2/26-7:
23-24; 25-26;
22-23; C7/160: 149;
156;
141)
As will be seen efficiency has many
meanings in Economics including: allocative, consumer, economic,
exchange, producer and technical efficiency. In all cases, to
measure efficiency one must be able to quantify both inputs and outputs.
This is possible in the case of the resource and manufacturing
industries with physical inputs and outputs but not so much for the
service industries including government. In introduction consider
technical and economic efficiency. Technical efficiency is achieved
when it is not possible to increase output without increasing inputs.
Economic efficiency, on the other hand, occurs when the cost per unit
output is as low as possible. All economically efficient solutions are
technically efficient but not all technically efficient solutions are
economically efficient.
ii -
Effectiveness
For some goods and most services inputs
and/or outputs cannot be directly measured and hence technical and
economic efficiency cannot be calculated. Accordingly, a less stringent
test - cost effectiveness - is used. Surrogates or proxy indicators of
inputs and outputs are developed. Consider the criminal justice
system. How do we measure its inputs and outputs or its success? The
number of arrests? The number of convictions? The “recidivism rate”
measured as the percentage of repeat offenders? The related rate of
rehabilitation? Case load per parole officer? Or the more difficult to
measure opportunity cost of resources in alternative applications,
e.g., early education?
iii -
Elasticity
(MKM C5/97-117:
90-110;
97-117;
86-105)
Elasticity refers to the sensitivity of
one variable to a percentage change in another variable. As we will be
seen, in Economics there are many forms of elasticity including: income
& price elasticity of Demand, price elasticity of Supply and
cross-elasticity or the elasticity of substitution. In all cases there
are three types:
elastic
when a 1% change in one variable results in a greater than 1% change in
the other, e.g., a 1% increase in price results in a 5% decrease
in sales;
unitary
when a 1% change in one variable results in a 1% change in the other;
and,
inelastic
when a 1% change in one variable results in a less than 1% change in the
other, e.g., a 1% increase in price results in a 0.01% decrease
in sales.
iv -
Employment
In daily life employment is usually
associated with Labour. In Economics, however, all factors of
production including Capital and Natural Resources are subject to
over-employment, full-employment, under-employment and unemployment.
In the case of Capital, capacity
utilization measures employment of physical plant and equipment.
Generally, 85% capacity utilization is considered full employment of
Capital allowing for downtime and maintenance.
Similarly, employment or exploitation of
Natural Resources may be over, fully, under- or simply unemployed and
left in situ. Appropriate conservation methods are required to
determine the appropriate level of exploitation.
In the case of Labour, the Labour force is
defined as all persons between 15 and 65 years of age. The participation rate is the percentage of the
Labour force that has or is actively seeking employment [MKM Macro Fig. 9.3]. There are various types of unemployment
including:
frictional
exists when there is a job available for every worker who wants one but
some will always be between jobs, i.e., unemployed;
seasonal
characterizes industries like farming, fishing, forestry and skiing;
cyclical
follows the business cycle, up and down;
structural
reflects, among other things, the impact of technological change making
existing skills redundant, e.g., the Canadian Maritime provinces
were world leaders in sailing technology but the entire industry
disappeared with the shift from wood and sail to iron and steam late in
the 19th century; and,
the natural rate
of unemployment accounting for frictional, seasonal cyclical and
structural unemployment. The natural rate varies between countries due
to structural and policy factors such as unemployment insurance programs
[MKM Macro Fig. 9.4].
v -
Endogenous/Exogenous
Economic models like the Standard Model
are closed system. Within the system variables are endogenous, inside.
Variables outside the system are exogenous, e.g., changes in the
Law, political instability, civil unrests or calm. Some variables may
be both. Take technological change. In Economics technological change
refers to the impact of new knowledge on the production function of a
firm or nation.
Endogenous technological change emerges
from the pursuit of profit. Thus industrial research and development or
R&D includes minor modifications or tinkering with existing Capital
plant and products called ‘development’. R&D varies significantly
between firms and industries. At one extreme, a change may be
significant for an individual firm but trivial to the economy as a
whole. On the other hand, there are ‘enabling technologies’ such as
computers or biotechnology that influence all industries.
The source of exogenous technological
change is outside the economic process. New knowledge emerges, for
example, in response to the curiosity of inventors and pursuit of
‘knowledge-for-knowledge-sake’, i.e., pure research usually
conducted in universities. Exogenous change, with respect to a firm or
nation, falls like manna from heaven.
vi - Equilibrium
(MKM C4/79-85:
74-80;
76-82;
70-75)
Equilibrium is a condition once achieved
continues indefinitely. In Economics there are different types of
equilibrium but for our purposes only two need be considered
Stable Equilibrium:
refers to a condition which once achieved self-adjusts to any change
maintaining the equilibrium state - homeostasis. Changes causing a
shift out of equilibrium generate forces leading back to equilibrium.
Consider a ball resting at the bottom of a cup; shake it and the ball
moves; stop shaking and it returns to the bottom of the cup. As we will
see, in market equilibrium price/quantity ‘clears’ the market - the
quantity demanded exactly equals the quantity supplied. If price rises
above equilibrium supply exceeds demand - a surplus is created; if price
drops below equilibrium demand exceeds supply - a shortage. Market
forces then drive the system back to the equilibrium clearing the
market; and,
[MKM
Figs. 4.8]
Unstable Equilibrium:
refers to a condition which once achieved does not self-adjusts to
maintain the equilibrium state. Consider a ball resting on the top of
an overturned cup - shake it and the ball falls off never to return to
the same place.
vii - Equity
(MKM C1/5:3; C12/264-70:
247-253;
273-278;
253-258)
The economic concept of Equity evolved out
of a distinct strand of English legal history. Together with the Common
Law, Equity emerged during the reign of Henry II (1133 –1189). Those
interested in the legal origins of Equity, please see
Observation #
3: Equity.
The Common Law is concerned with right and
wrong, guilt or innocence. Equity is concerned with fairness. Economic
concepts of Equity derive from legal Equity. Thus the Chancellor of the
Exchequer (in Canada called ‘the Minister of Finance’) exercised
concurrent jurisdiction in Equity with the Lord Chancellor’s Court.
There are two economic definitions of
Equity, each reflecting its historical roots. First, there is Equity as
the financial capital of a limited liability corporation which, after
deducting liabilities to outsiders, belongs to the shareholders. Hence
shares in a limited liability corporation are known as equities. This
links back to the historical development of trusts under Equity.
Second, there is Equity as ‘fairness’.
While usually used with reference to taxation it is a general economic
concept. With respect to taxation Equity has three dimensions:
horizontal, vertical and overall. Horizontal Equity refers to ‘like
treatment of like’. Vertical refers to ‘unlike treatment of unlike’.
Overall Equity refers to the accumulated impact of all forms of
taxation. Crudely, it is the difference between earned and disposable
income, i.e., income net of all taxes – income, excise, sales,
et al. Equity is also used to justify market intervention by
Government, e.g., minimum wage and rent control.
It is important to distinguish between
equity and equality. Equity is about fairness, given the facts of
a situation. Equity is part, not just of law and economics, but
also of ethics, the science of morals. It is not biased in favour
or opposed to equal, egalitarian outcomes. Outcomes simply must be
fair. The difference between equal opportunity and equal outcomes
highlights, in a way, the difference between equity and equality.
In this regard, Kenneth Boulding entitled his
Presidential address to the 81st meeting of the American Economic
Association in Chicago, December 29, 1968:
Economics
as a Moral Science.
viii - Ethics/Moral
Sentiments
#8 of the Ten Humorous Reasons for
studying economics reads: Although ethics teaches that virtue is its own
reward, in economics we get taught that reward is its own virtue. This,
alas, from a now dark website: JokEc.
While self-interest or ‘Me-ism’ lays at
the heart of economics it is in fact qualified by moral considerations.
Thus while Adam Smith is remembered as the founder of modern economics
with the 1776 publication of his Inquiry into the Wealth of Nations
some 17 years earlier in 1759 he published The Theory of Moral
Sentiments (1759) providing the ethical, philosophical,
psychological, and methodological underpinnings of all his later
works.
Today such concerns are summed up as
‘market sentiments’. Such sentiments include, among other things,
trust. Overtime buyers and sellers, producers and suppliers, employers
and employees develop trust reducing what are called transactions
costs. Without such trust every exchange must be carefully and
expensively scrutinized to insure all terms of a contract are fulfilled
by both parties. In times of recession, such as now, relations tend to
break down with producers and/or their suppliers going out of business,
employees laid off, etc. Like a rug or woven sweater relations
unravel and if this last long enough new supplier or new employees must
be engaged who, at the beginning of the relationship at least, are
subject to uncertainty and a lack of trust raising transaction costs.
ix- Excludability
(MKM
C11/236:
221;
243; 224)
Private goods exhibit excludability and
rivalrousness. If I buy a car I exclude you by lock and key.
Similarly, if I am driving I exclude you, i.e., driving is
rivalrous. Public goods, on the other hand, are non-excludable and non-rivalrous,
i.e., it is hard to stop me from consuming and my consumption
does not reduce the amount available to you.
If I watch a fireworks display it does not
reduce the amount available to you. Similarly, public goods are
non-excludable, i.e. a user cannot be easily prevented from
consuming it. This creates the ‘free-rider’ problem. Extending the
fireworks example, while I will not pay to enter the stadium I can watch
from my apartment balcony at no charge. Allowing for externalities
(discussed below) there is in fact a spectrum of goods ranging from pure
private to pure public.
x -
Externalities
(MKM
C10/211-221:
198-216;
219-238;
201-219)
The Standard Model assumes that market
price ‘internalizes’ all relevant costs and benefits. This means the
consumer captures all benefits and the producer pays all costs at market
price. An externality means there are costs or benefits not captured by
market price, e.g., the social benefits of higher
education or the health costs of pollution.
7.
Is
Economics a Science?
(MKM C2/22-9:
19-26;
20-29)
Ideology & Theology assert Certainty. Science asserts Doubt.
HHC 23/06
“In the days when an idea could be silenced by showing that it was
contrary to religion, theology, was the greatest single source of
fallacies. Today, when any human thought can be discredited by branding
it as unscientific, the power exercised previously by theology has
passed over to science; hence, science has become in its turn the
greatest single source of error.” (p. 480)
Michael Polanyi, “Scientific
Outlook: Its Sickness and Cure”, Science, New Series, 125
(3246), March 15, 1957, 480-484.
It seems to me that this failure of the economists to guide policy more
successfully is closely connected with their propensity to imitate as
closely as possible the procedures of the brilliantly successful
physical sciences - an attempt which in our field may lead to outright
error. It is an approach which has come to be described as the
“scientistic” attitude - an attitude which, as I defined it some thirty
years ago, “is decidedly unscientific in the true sense of the word,
since it involves a mechanical and uncritical application of habits of
thought to fields different from those in which they have been formed.”
(p. 3)
F. A. von
Hayek, “The
Pretence of Knowledge”, Nobel Memorial Lecture, December 11, 1974,
American Economic Review, 79 (6), December 1989, 3-7
So, is Economics a science? Yes and no. It depends on how one defines
Science. The word Science comes from the Latin scire “to know”
which, in turn, derives from scindere “to split”. One gains
knowledge by splitting or reducing a question into smaller and smaller
parts until a fundamental unit or force is revealed. This is
reductionism. It should also be noted that the English word
'reason' derives from the Latin ratio meaning calculate. In
turn this means using numbers.
Until the Scientific Revolution of the
17th century such splitting and reducing was restricted to words. With
innovation of the experimental instrumental method, the Natural &
Engineering Sciences (NES) exploded. Ideally NES engages controlled
experimental conditions. It holds all factors constant, e.g.,
heat, humidity and air pressure, then changes one or introduces a new
variable (cause) to see the result (effect). Then repeat to confirm
results. Peer review then involves other scientists replicating the
experiment and obtaining the same results under the same controlled
conditions.
In the 20th century new disciplines of the
NES emerged that I call ‘Synthetic Sciences’. These include
climatology, ecology and environmental studies. Rather than reducing a
question to ever smaller components (reductionism), the synthetic
sciences weave them together into a functioning whole (synthesis). This
whole is usually represented in a highly complex mathematical model of
the biosphere, climate, ecology or natural environment. Controlled
experimental conditions are possible only for some components and
currently impossible for the functioning whole. Replicability remains
mathematical. The effects, however, of modeled changes can be assessed
against real world changes but on time scales varying from a day to 1,
5, 50, 5,000 or more years into the future.
i- Sciences of the Natural & Artificial
Both the traditional and emerging
synthetic NES remain subject to the laws of nature. Economics, however,
is a Social Science. It is, to use a term coined by economist Herbert
Simon, ‘a science of the artificial’. Economics and all other Social
Sciences are primarily governed by human laws, not the laws of nature.
And human laws, unlike the laws of nature, are very mutable indeed.
Consider recent changes in banking law and
introduction of new technology that transformed the definition of a
successful business model. Think of the so-called FANGs: Facebook,
Amazon, Netflix and Google. Think of negative interest rates.
ii - Induction & Deduction
Like the traditional and synthetic NES,
the Social Sciences use two forms of logic: induction and deduction.
Induction involves reasoning from a particular observation to a general
conclusion, e.g., from an observation comes a theory. Deduction involves reasoning from the general to a
particular. In this course, deductive logic is the engine of analysis.
You will be given a set of fixed assumptions defining an initial
equilibrium. One assumption will be changed. You must deduce the
result.
iii – “Let Us Assume” & Ceteris Paribus
(MKM C2/22-4: 19-21;
20-22;
18-20)
An expression often heard from economists
is ‘let us assume’. Consider the joke about the economist,
mathematician and physicist marooned on a desert island with crates of
canned food and no can opener. The physicist says: I can start a fire
and blow the top off”. The mathematician says: “And, I can calculate
the trajectory of the food so we can catch it.” The economist says:
“Let’s assume we have a can opener”. Laugh, laugh, laugh, stupid
economist!
But consider. The physicist has no
equipment to measure the energy content of the fuel for the fire, nor
instruments to measure the can’s tensile strength and therefore cannot
determine when it will blow. The mathematician cannot, therefore,
calculate the trajectory of the food. The economist, on the other hand,
looks for a sharp rock to act like a can opener. One of my professors,
Gilles Paquet, called economists tool-bearing animals with the head
serving as the tool box. The deductive logic of economics is one such
tool and is used in other disciplines including Law and the NES.
One of the most important and regularly
used assumptions of Economics is ceteris paribus or ‘all other
things being constant’. Thus in analyzing a given phenomenon economists
begin by assuming all factors or forces are constant and then changes
one. This is a critical in economic analysis. For example, if the
price of a good or service changes, analysis is nearly impossible if the
price of all substitutes changed at the same time. To determine the
effects of a price change, economists assume all other prices remain
constant (in the first round).
In effect, the controlled experimental
conditions of the NES become a set of fixed assumptions in Economics, a
model. Changing one controlled condition or introducing a new variable
(cause) leads to a result (effect). Changing a fixed assumption of a
model or introducing a new variable in Economics (cause) leads to a
changed equilibrium (effect).
iv - Positive & Normative (MKM C2/30:27;
28; 25-26)
As a science of the artificial Economics
answers two types of questions. The first type ask: What is? Such
questions are called positive, i.e., they involve no value
judgment. The second asks: What ought to be? Such questions are called
normative, i.e., they involve a value judgment. For example, it
is a positive statement to say about 20% of Canadians live in poverty.
It is a normative statement to say, for reasons of Equity, we should
redirect national income to help them.
v - Observation & Measurement
(MKM C2/22-4:
19-21;
20-22;
18-20)
It is usually forgotten that the
Scientific Revolution involved the design and construction of
instruments that can measure and report experimental results. Such
instruments reach spaces and places above, below and beyond the reach of
the human senses. Ever tried to manipulate DNA by hand? One of the
strengths of the NES is that once calibrated such instruments report
back without human mediation of the evidence.
What distinguishes the Social Sciences
(sciences of the artificial) from the NES is that every step of the
evidentiary trail is mediated by human beings from marketing surveys to
final data manipulation. Consider the Census.
The Census is something that North
American economists rely on for in-depth measurement of a range of
economic phenomenon including the Census of Population (age and other
demographic characteristics as well household expenditures and consumer
capital goods) and the Census of Business Enterprise. While there are
technical limitations to the Census, e.g., does it ask questions
that elicit meaningful answers, there are also social limitations. In
continental Europe, for example, the Census of Population is not very
reliable because of traditional suspicion of government many, many
people simply do not answer or even lie. Similarly, different companies
use different accounting methods and when answering the Census of
Business do not necessarily use the same Generally Accepted Accounting
Principles (GAAP).
The bottom line: numbers, particularly in
the sciences of the artificial, have quality. They are collected using
inherently imperfect methodologies. They have parents who may have
their own agenda, some abusive. In the NES, this last point is referred
to as ‘experimenter expectation’. Again, what distinguishes Social
Science evidence from that in the NES is that every bit is mediated by
human beings from marketing survey to data manipulation.
Economics is better off than other Social
Sciences because evidence is generated by transactions that usually leave a
record without interfering with individual behaviour. Thus when one
buys a chocolate bar, a car, a stock or bond or a house records are
generated for tax and other purposes allowing statistical evidence to be
collected. In addition such transactions are conducted using the same
unit of account: money. Compare this to a sociologist studying the
partying behaviour of first year university students. He or she must
rely on survey information provided by students and/or attend parties as
a participant observer risking a ‘contact high’ and other forms of
subjective engagement.
vi– Modeling & Testing (MKM C2/24-9:
21-26;
22-27;
20-24)
The world is a very complex place. Models
are used to reduce this complexity. For those interested in the historical
and philosophical roots of modeling, please see:
Observation #4:
Modeling.
An economic model is a simplified
description of the
whole
or some part of the economic system, e.g.,
Supply and Demand. A set of assumptions or premises are made and
conclusions deduced. One thing both inductive and deductive model
building share in common is ‘assumptions. Assumptions are used to
ignore or simply hold constant selected variables. A model thus tries
to explain how certain variables react to changes in other variables,
but not all possible variables. The world is simply too complex to be
fully modeled.
Having constructed a model of some
economic phenomenon, economist then attempt to test its predictions
against empirical evidence including statistics and descriptive
observation. If the predictions accord with the evidence, the model or
theory is held true (for the time being, i.e., until new evidence
contradicts the model); if not, it is rejected.
Many theories in Economics, however,
simply cannot be tested. For many we simply lack the technology. For
example, the theory of revealed preference developed by Paul Samuelson.
It says preferences of consumers are revealed by actually buying goods &
services, not by what they say. However, it is simply not possible to
track a large number of consumers over time holding all other factors
fixed, for example, age, income and education, all of which affect
taste.
Two recent developments - behavioural
economics and social media - expand our potential technologies of
measurement. Behavioural economics uses small scale experiments to test
selected microeconomic theories and assumptions, e.g., a narrow
definition of rationality. Findings have increasingly fed through to
public policy as policy ‘nudging’. In this regard, with an ever
expanding internet and social media marketeers can formulate
psychographic profiles of existing and potential consumers by data
mining Big Data. Such evidence, however, is not in the public domain.
It is proprietary.
Psychographic mining Big Data promises
confirmation or rebuttal of revealed preference but it is proprietary
and commercial in nature. As such there is no published methodologies
for outsiders to assess data quality nor access it for research
purposes. Other economic theories also could be put to empirical
testing if such new technologies of measurement were made accessible to
academic, business, non-profit and public sector economists. It is not
widely recognized that years of public sector austerity have had
debilitating effects on Statistics Canada and other national statistical
agencies on the quantity and quality of their products. Private sector
assistance could help compensate for the damage done and thereby foster
public policy that is better evidence based. Is the corporate sector
willing? How could privacy be protected?
vii - Conclusion
First,
Economics is a ‘science of the artificial’, one of the Social Sciences.
As such it is primarily subject to mutable human law not the invariable
laws of nature. A bridge stands or falls based on the constant and
unchanging laws of physics. Economic theories, however, stand, fall or
mutate with the changing cultural, historical, legal and technologic
conditions of society.
Furthermore, the Social Sciences are not,
in general, experimental sciences. Their social theories cannot be
directly tested. There are no replicable laboratory conditions for an
economy let alone an entire society. There are, in fact, strict laws
limiting human experimentation. Evidence is thus primarily generated by
observation. With respect to Economics I write ‘’in general’ to allow
for behavioural economics which conducts small scale or
micro-experiments whose findings while insightful do not currently
permit construction of an overarching theory of Economics.
Second,
without access to objective instrumental measurement as in the NES, the
evidentiary trail in the Social Sciences is generated and mediated by
human beings from beginning to end. Unlike the other Social Sciences,
however, Economics has access to the next best thing to a scientific
instrument: Money. Daily life leaves an evidentiary trail of monetary
transactions. Whether it is the bread we eat or the video streaming
service to which we subscribe all can be counted using money as the unit
of account. You can’t compare apples and oranges but you can compare
their price per dozen.
Third,
the inherent limitations of the Social Sciences highlights the fact that
Science means more than experimental science with replicability as its
standard. In fact, the rules of evidence and how it is collected,
organized and systematized varies dramatically between knowledge
domains: the Natural & Engineering Sciences (NES), the Humanities &
Social Sciences (HSS) and the Arts. Science, in this general sense,
means an organized and systematized body of knowledge, a way of
knowing. Accordingly, in Economics as in the other Social Sciences many
theories are accepted not because they can be tested but because they
are ‘believable'.
Fourth and finally, the word 'economy' derives from the ancient Greek oikos meaning ‘house’
and nemo meaning ‘manage’, i.e. managing the house. It shares
this root with ‘ecology’ deriving from oikogie meaning modes of life and
relations within
and about
the house. Ekistics - the science of human settlement - also
derives from oikos but in the sense of founding an ancient Greek colony
like Syracuse or the numerous city states established by Alexander the Great in
India at the end of the 4th century before the common era.
Economics as management of the household raises the question: What is the
relevant household? In its original sense it was the self-sufficient or
autarkic rural estate. Management, however, ascended to higher orders as the
self-sufficient village, town, city and most recently the Nation-State. A
global society in which there is contiguous urban development separated only by
natural barriers – mountains, oceans and deserts - has been called the
Ecumenopolis – the World City - by urban planner Constantinius Doxiadis; its
global reality is visible in a composite photograph of “The
World at Night” published by NASA in the year 2000. If seeing is believing
then it provides visual evidence of humanity enframing its home planet. We see
a World City whose shimmering lights soar out into the infinite blackness of
space. It shows us one planet, one biosphere and one human race lighting
up the darkness. However, there is not yet a global economics, no generally accepted
model for managing the planet.